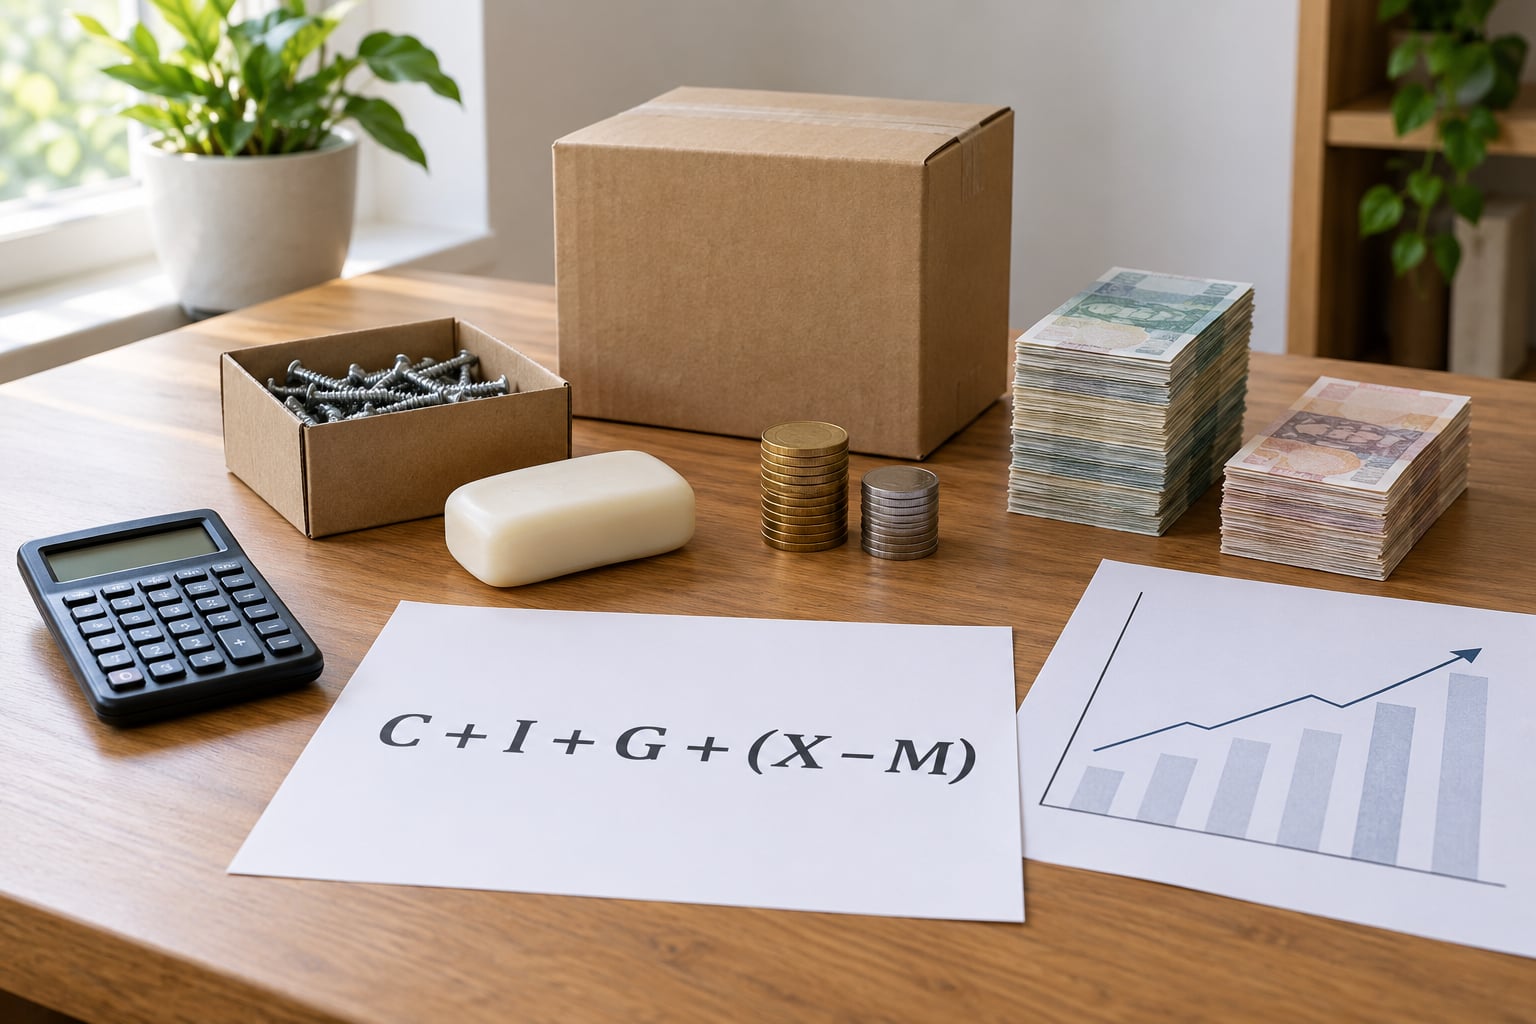
Gross domestic product is the total market value of all final goods and services produced inside a country’s borders during a set period, usually a quarter or a year. Statisticians add it up three ways, from spending, from production and from income, then strip out inflation to get real GDP.
That is the mechanical answer. The more useful answer to how GDP is calculated and what it means is that GDP is a scoreboard, not a report card: it tells you the size of the output pie, not who got which slice or whether people are happy at the table. I’ll walk through the arithmetic first, then get into what the number quietly leaves out, because most confusion I see about GDP comes from treating a measurement as a verdict.
Table of Contents
- What Does GDP Measure?
- How GDP Is Calculated and What It Means
- The Three Ways GDP Is Calculated
- The Expenditure Approach: C + I + G + (X – M)
- The Production Approach: What Goods and Services Count?
- The Income Approach: Where the Money Goes
- Real GDP, Nominal GDP, and GDP Growth
- How the GDP growth rate is actually calculated
- What GDP Can and Cannot Tell You
- How Investors and Households Can Read GDP Data
- Frequently Asked Questions
- How is GDP calculated in simple terms?
- Does GDP tell you how rich a country is?
- Why is GDP a flawed metric?
- What counts as a good GDP growth rate?
- Is a recession the same thing as a GDP contraction?
- Why does GDP not equal the average person’s income?
- Conclusion
What Does GDP Measure?
GDP measures the total value of final output produced inside a country’s borders in a specific period. Two words in there do most of the work: “final” means only the last good or service in the production chain, so a car’s value counts but the steel inside it does not count separately, and “period” means GDP is always a flow, never a stockpile.
Three boundaries are worth holding onto. Geographic: production counts where it happens, so a factory in Ohio owned by a foreign parent is in US GDP, while profits sent back abroad are not counted as US income. Output: GDP measures production, not wealth, so a house built this year adds to GDP while a house bought from another owner does not. Time: GDP is measured per quarter or per year, and comparing two of them tells you how the size of the economy moved.
Because it’s a measure of production, GDP is also not the same thing as how rich a country feels. It does not adjust for how the output is divided, and it counts government activity by its cost rather than by the value anyone gets from it. Economists use GDP anyway because it’s consistent, widely measured and available every quarter, which is more than most alternatives manage.
How GDP Is Calculated and What It Means
Calculated in its simplest form, GDP is the total market value of final goods and services produced within a country during a specific period. The addition is the whole trick: instead of adding up every individual transaction, which would count the same dollar several times, the statistician adds up distinct categories of spending, or the value each industry adds at each stage.
A small example makes the arithmetic concrete. Suppose a country sells 100,000 haircuts at $30 each and produces 1,000 laptops that sell for $1,200 each. Spending on those final haircuts is 3,000,000 dollars and spending on those final laptops is 1,200,000 dollars, so GDP for that period is 4,200,000 dollars. The scissors, the shampoo, the imported laptop components and the marketing work that moved the laptops from the factory to a shelf are all part of getting there, but only the value added at the final step is counted once.
The period matters because GDP is a rate, not a level. When you read that US real GDP grew at an annualized 2.3 percent in a quarter, you are not being told output is 2.3 percent higher than last year. You are being told that, if the pace of the last three months continued for a full year, output would be 2.3 percent bigger at the end of it than it was at the start.
The Three Ways GDP Is Calculated
How GDP is calculated comes down to three approaches, and each one is the same number seen from a different direction. In practice national statisticians publish all three, then reconcile any gap between them.
- The expenditure approach adds up what buyers spent: household consumption, business investment, government purchases and net exports. This is the headline method in the United States, where the Bureau of Economic Analysis leads with it.
- The production or output approach adds up the value each industry adds to the goods and services it produces. This is the standard method in the UK, where the Office for National Statistics publishes it first.
- The income approach adds up the incomes generated by that production: wages, rent, interest and profits. It produces the measure called gross domestic income, which is mathematically identical to GDP in theory and never quite identical in practice.
| Approach | What gets added | Where it is used most |
|---|---|---|
| Expenditure | Spending on final goods and services | United States, Japan, most large economies |
| Production | Value added by each industry | United Kingdom, most European Union members |
| Income | Wages, rent, interest, profits, taxes | Cross-check on GDP, called GDI in the US |
Eurostat and national accounts offices across the European Union lean production-side, the OECD publishes all three, and the International Monetary Fund and World Bank harmonize the definitions so their country comparisons mean the same thing everywhere. If a source tells you GDP, it is worth asking which approach it used and whether it is nominal or real.
The Expenditure Approach: C + I + G + (X – M)
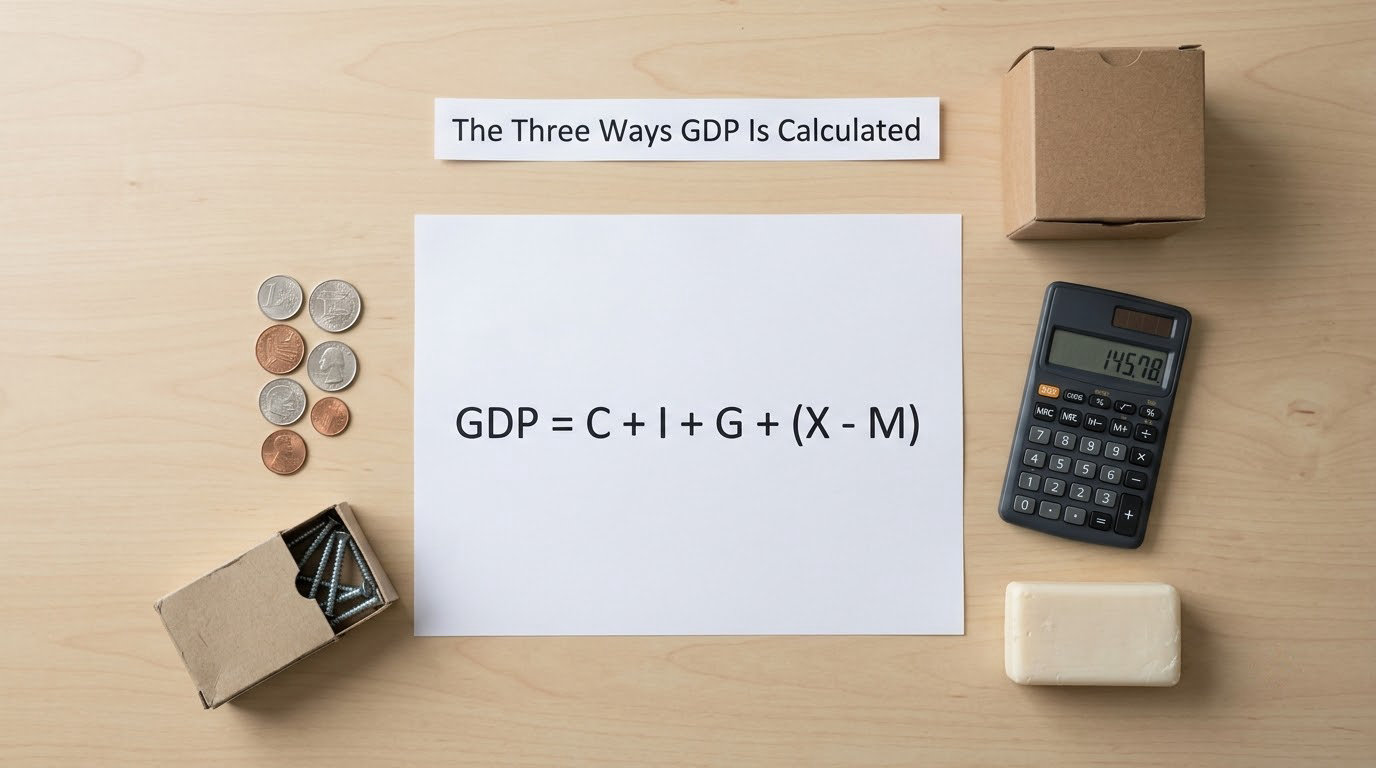
The expenditure approach is the formula most people picture when they think about GDP: GDP = C + I + G + (X – M). Every dollar spent in the country falls into one of those five buckets, which is why the approach works. If you add up all final spending, you have counted every final good exactly once.
| Letter | Component | What it covers | Rough share of US GDP |
|---|---|---|---|
| C | Personal consumption expenditures | Household spending on goods and services, plus the services homeowners effectively buy from themselves, such as imputed rent | About two-thirds |
| I | Gross private domestic investment | Business spending on equipment, structures, inventories and residential construction, after subtracting depreciation | Roughly a sixth |
| G | Government consumption and gross investment | Government purchases of goods and services, including pay for public employees and defense procurement | Roughly a sixth |
| X | Exports | Goods and services produced domestically and sold abroad | Roughly a tenth |
| M | Imports | Goods and services produced abroad and bought here | Roughly a tenth, which is why net exports are usually negative |
Here is the worked example. Take a fictional economy and assume these annual figures: households spend 6,000 billion dollars, firms invest 2,000 billion dollars, government purchases 2,500 billion dollars, exports bring in 1,500 billion dollars and imports take out 1,700 billion dollars. Total GDP is 6,000 + 2,000 + 2,500 + (1,500 – 1,700) = 10,300 billion dollars.
Note that the trade deficit of 200 billion dollars reduced the total rather than adding to it, and that is not a penalty. Imports were already counted, once, inside household or business spending. Counting them again as a separate negative would deduct the same money twice, so the formula subtracts them to strip out the portion of domestic spending that went to foreign producers.
The same reasoning explains a question that comes up constantly: why does a large importing country not look smaller? It does, in one sense. A wide trade deficit trims GDP through the net exports line, which is one reason tariff fights and import surges show up as weaker GDP growth without anyone actually producing less at home.
The Production Approach: What Goods and Services Count?
The production approach starts from the other end and counts how much each industry adds. For an industry, value added equals the value of its output minus the value of the intermediate goods it bought from other industries. That subtraction is the entire reason the production approach avoids double counting.
Think of a loaf of bread. The mill adds value turning wheat into flour, the baker adds value turning flour into bread, and the grocer adds value getting the loaf to a shelf. Summing the output of all three would count the same physical loaf three times. Counting only what each stage added, the mill’s contribution, the baker’s contribution and the grocer’s contribution, reproduces the price the consumer pays and counts the loaf once.
So the units that count are final goods and services delivered to their ultimate purchaser. Cars, software subscriptions, a nurse’s shift and a delivered meal count. The steel that went into the car and the flour that went into the loaf do not, because those are intermediate goods bought by someone who is themselves part of the chain.
Statisticians group industries into categories such as agriculture, mining, manufacturing, construction, wholesale and retail trade, information, finance, professional services, education and health services. Individual establishments are assigned to the industry that describes most of their economic output, which is why a company can sit awkwardly in the categories when it makes several very different kinds of thing.
The Income Approach: Where the Money Goes
The income approach counts what production pays out instead of what buyers pay. In its fullest form, that is employee compensation, proprietors’ income, rental income, corporate profits, net interest, plus taxes on production and imports minus subsidies. In the US presentation it is called gross domestic income.
In theory every dollar of spending lands as someone’s income, so GDP and gross domestic income must be the same number. They rarely match exactly in the published data, and the gap is informative rather than embarrassing: it points to measurement error running in one direction, because the two sides are collected from different sources.
That gap is also why a related measure, gross national product, exists. GDP counts production inside the border. GNP counts production by the country’s residents, wherever it happens, so it adds income flowing in from abroad and removes income flowing out to foreign owners.
Real GDP, Nominal GDP, and GDP Growth
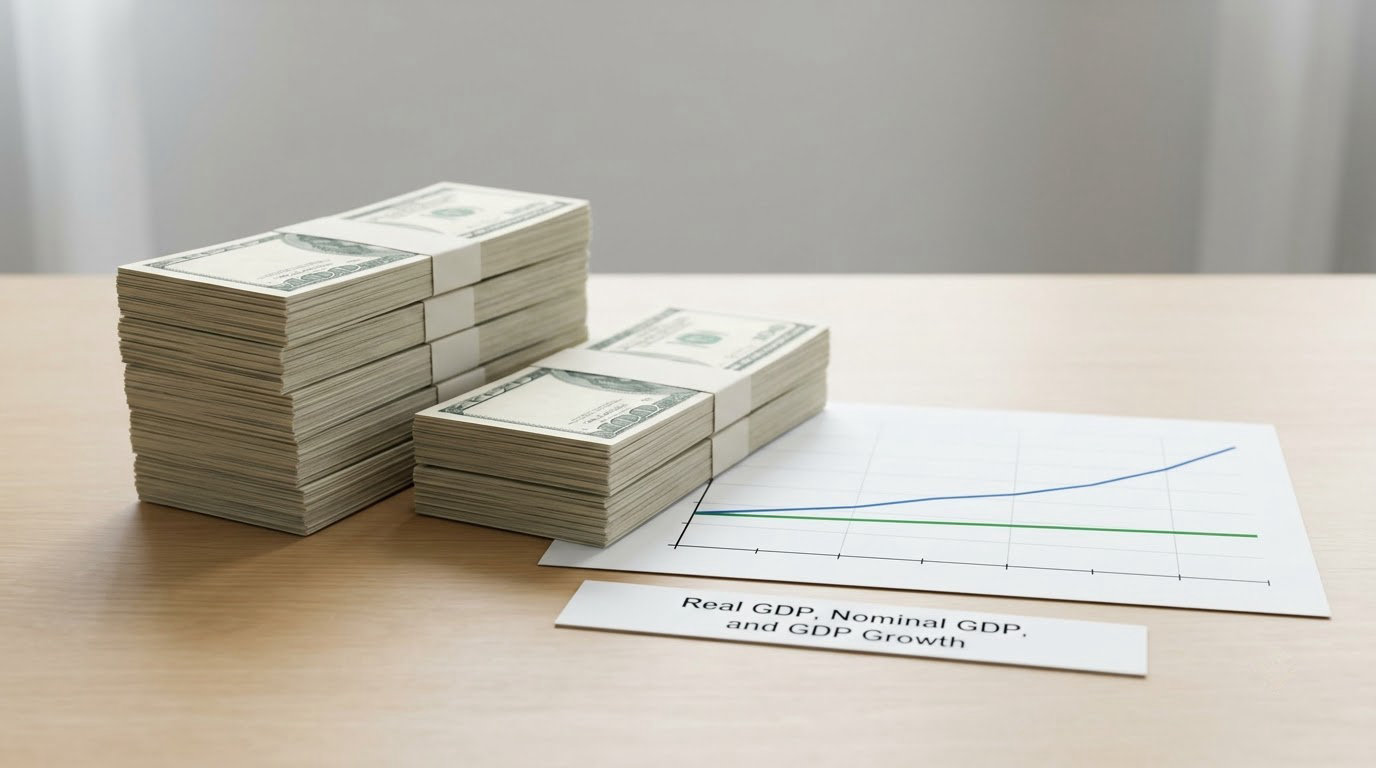
Real GDP is nominal GDP adjusted for price changes, and real GDP is the version that tells you whether the economy actually produced more. Nominal GDP can rise because output grew, or because everything got more expensive, or both at once. Stripping out inflation separates those two stories.
How the GDP growth rate is actually calculated
Growth is a percentage change between two comparable periods. When nominal GDP rises from 30 trillion dollars to 30.9 trillion dollars in a year, the raw increase is 900 billion dollars. Subtract an inflation rate of 3 percent and the real increase is close to 100 billion dollars, or about 0.3 percent real growth. Same headline dollar gain, completely different economy.
The inflation gauge that matches GDP is the GDP deflator, which is nominal GDP divided by real GDP, multiplied by 100. A deflator reading of 103 means the average price of domestically produced final goods rose 3 percent over the base year. It differs from the consumer price index because it covers what is produced here rather than what is bought here, so it moves differently when prices of imported goods, housing or medical care shift.
Statisticians express real GDP in chained dollars, using a base year fixed at recent levels and a chain-weighted price index rather than a single base year. Chaining avoids the distortions that come from picking one year whose price structure happens not to look like any other year. Reported quarterly figures are also seasonally adjusted and stated at a seasonally adjusted annual rate, which is why a mild quarter can post a headlining rate that looks far too strong.
GDP is a lagging indicator. It reports on a period that has already finished, arrives weeks later and is then revised, so it describes the economy rather than warning about it. Central banks care for that reason: they set policy on inflation and labor markets in real time, not on a backward-looking output number.
What GDP Can and Cannot Tell You
GDP is a useful measure of economic activity with well-known blind spots, and the honest version of the answer to what GDP means is a size, not a verdict. Here is what it does not capture.
- Distribution. A country can add output while the gains go to a small group. GDP says nothing about the gap.
- Informal and household work. Cash-based work and unpaid caregiving sit largely outside the counts, even though the second kind keeps households running.
- Free and digital goods. A search engine delivers enormous value at a price of nothing, so it barely registers in a market-value measure.
- Environmental and depletion costs. Resource extraction shows up as production; the depletion of the resource does not subtract from it.
- Quality changes. When a repair costs more but lasts far longer, the price index has no clean way to see the improvement.
- Composition. Two economies of identical size can produce completely different things, which is why war output and care work are not comparable totals even when both are large.
Three misconceptions are worth clearing up directly. Government spending does count toward GDP, but only for what it buys, and transfers to households are excluded because no good or service changes hands. The national debt is not subtracted from GDP, since borrowing is a financing decision rather than a reduction in what was produced. And a contribution from one company is not the same as national output: a firm’s revenue can include inputs bought from other businesses, which is exactly what the value added method removes.
None of this makes GDP useless. It makes GDP a first measurement rather than a final word, and researchers use alternatives alongside it, from gross domestic income and net national product to genuine progress indicators, median income measures and the distributional accounts that sit beside the headline tables.
How Investors and Households Can Read GDP Data
A quarterly release is easier to read than most people expect. In the US, the Bureau of Economic Analysis publishes an advance estimate about four weeks after the quarter closes, a second estimate about a month later, and a third, final estimate a month after that. The advance figure is the one that moves markets, because it is the first look. Later revisions are usually minor, though benchmark revisions can be much larger and rewrite several years at once.
So a practical four-step reading routine. First, check whether the number is real or nominal and whether it is seasonally adjusted at an annual rate, because a quote stripped of that context can be read backwards. Second, look at the contributions rather than the headline, since growth driven by inventories or government spending behaves differently from growth driven by consumer spending. Third, compare it with what markets expected, since a strong number that misses expectations can still disappoint. Fourth, treat it as a lagging confirmation of what employment and inflation data already suggested.
Pair GDP with the other indicators rather than reading it alone. Employment and average hourly earnings say whether output gains are reaching workers. The consumer price index and the personal consumption expenditures price index say whether real spending is keeping up. Retail sales, housing starts and business equipment orders give a faster read on current demand. Interest rates and the yield curve tell you how policy is leaning.
For households, the practical translation is looser than for investors. GDP does not predict your paycheck or your portfolio; it describes the environment those sit in. Recessions defined by two consecutive quarters of declining real GDP have been followed by weaker hiring and flatter wage growth, though two negative quarters alone are a weak signal, which is why the National Bureau of Economic Research weighs a dozen indicators before dating a recession. Rules and rates vary by country and change over time, so treat all of this as general information rather than financial advice.
Frequently Asked Questions
How is GDP calculated in simple terms?
GDP is the total market value of final goods and services produced within a country’s borders during a set period, such as a quarter or a year. Statisticians add up spending, output value added by each industry, or the incomes that production pays out, then adjust for inflation to produce real GDP. Only final goods count, so a car’s value counts but its components do not count again.
Does GDP tell you how rich a country is?
Not on its own. GDP measures the size of production, not how it is divided and not how well people live. A country can post steady GDP growth while median household income barely moves. GDP per capita and purchasing power parity figures adjust for population and price levels, which makes cross-country comparisons fairer, but distribution, health and leisure still sit outside the measure entirely.
Why is GDP a flawed metric?
The main problems are distribution, informal activity, unpaid household work, free digital goods, environmental depletion and quality improvements that price indexes cannot easily see. Measurement error and revisions add uncertainty, and two economies of equal GDP can produce entirely different things. Most researchers treat GDP as a first measurement and read it alongside gross domestic income, median income and distributional accounts rather than as a complete verdict.
What counts as a good GDP growth rate?
There is no universal number, because what counts as strong depends on population growth, productivity, inflation and where the economy sits in its cycle. Around 2 percent real growth in an advanced economy is often treated as a pace that keeps working-age population steady, while emerging economies can post much higher figures from lower bases. The more useful question is whether growth is above or below what consumers, employers and policymakers expected.
Is a recession the same thing as a GDP contraction?
No. A recession is a broad, significant, persistent decline in economic activity, which the National Bureau of Economic Research dates by weighing industrial production, employment, real income and sales rather than by one series alone. A recession often implies falling GDP, but the two-part definition of two consecutive quarters of declining real GDP is a shorthand, and GDP can contract during a downturn that is not formally dated as one.
Why does GDP not equal the average person’s income?
Because GDP is a total, not a per-person figure, and because a slice of domestic production is paid out as profits, rent and interest to owners rather than as wages. GDP divided by population gives a per-person average of output, which is not the same as what a typical household earns. That gap is why median income, wage growth and employment figures are read alongside GDP rather than derived from it.
Conclusion
GDP is the size of the production pie, calculated by adding final spending, industry value added or the incomes production pays out, and then adjusted for inflation so that the comparison means something. Start with real GDP rather than the nominal figure, read the contributions underneath the headline, and remember the number is revised and backward-looking.
Next time a growth print lands, check three things beside it: inflation, employment and what households are actually earning. Read together, they tell you whether GDP growth is reaching anyone, which is the question GDP was never built to answer on its own.