An earnings report is the quarterly disclosure a public company files with regulators, covering its income statement, balance sheet, cash flow statement and forward guidance. If you know how to read an earnings report, you can tell in about fifteen minutes whether a business is getting stronger or weaker, before anyone else on the news wires reacts.
You do not need an accounting degree. You need the press release, five numbers, and a rough sense of what the company promised last quarter.
This guide is for new retail investors, self-directed retirement investors, and anyone doing homework on a share before they buy it. It is educational only, not investment advice, and reporting rules and filing calendars differ by country and change over time.
Table of Contents
- What Is an Earnings Report?
- What Should You Read First in an Earnings Report?
- How to Read Revenue, Earnings, and Profitability
- How to Read the Balance Sheet and Cash Flow Statement
- How to Read Management Guidance and Earnings Calls
- How to Compare an Earnings Report With Previous Results
- Key Numbers and Terms to Check Before Investing
- Common Mistakes When Reading Earnings Reports
- Frequently Asked Questions
- Where can I find company earnings?
- What is Q1, Q2, Q3 and Q4 in a financial year?
- How do earnings reports affect share prices?
- How do I interpret earnings per share?
- What is the difference between GAAP EPS and adjusted EPS?
- How long does it take to read an earnings report?
- Conclusion
What Is an Earnings Report?
An earnings report is a public company’s periodic disclosure of how its business performed over a set period, usually three months. It contains the income statement, the balance sheet, the statement of cash flows, earnings per share, and management’s forecast for coming quarters.
Here are the key components to check, in the order most readers should approach them:
- Income statement: shows total revenue, the cost of goods sold, operating expenses, and net income, all for the period.
- Earnings per share (EPS): divides total profit by the number of shares, so profit can be compared across companies of different sizes.
- Balance sheet: lists what the company owns and what it owes on a specific date.
- Cash flow statement: tracks actual cash moving in and out through operations, investing, and financing.
- Guidance: management’s official forecast for revenue and earnings in the upcoming quarters.
In the US, the quarterly version is the Form 10-Q and the yearly version is the Form 10-K. Public companies release the numbers as a press release first, often before the market opens or after it closes, then file the formal documents with the SEC.
Regulated earnings supplements may also carry audited figures, so investors can treat the statements as a reliable window rather than a marketing exercise. Retirement investors tend to find the annual 10-K more useful, because it contains three years of comparable data and the full risk factor section.
What Should You Read First in an Earnings Report?
Start with the press release, not the filing. It is two or three pages, it contains the same numbers, and it saves you from opening a document that runs past a hundred pages.
- The press release. Revenue, EPS, the gap against expectations, and the guidance table all appear in the first two pages.
- The income statement. Work down from revenue to gross profit, operating income, and net income.
- The cash flow statement. This is where earnings either hold up or quietly fall apart.
- The balance sheet. A quick scan for cash, debt, inventory, and receivables.
- Management discussion and analysis, or MD&A. This is management’s own explanation of what changed and why, written in sentences rather than tables.
- The guidance and the earnings call. The forward-looking part, which usually moves the share price more than the reported quarter does.
Here is what each document gives you that the others do not:
| Document | What it contains | What you get from it |
|---|---|---|
| Press release | Headline results, segment detail, guidance | The 15-minute answer on whether the quarter was good |
| Income statement | Revenue through net income for the period | Growth and profitability trend |
| Balance sheet | Assets, liabilities, and equity on one date | Liquidity, leverage, and working capital health |
| Cash flow statement | Cash from operations, investing, financing | Whether reported profit turned into real cash |
| MD&A and footnotes | Management’s explanation, accounting detail, risk factors | Context, and the things the headline hides |
What you can safely skip on a first pass: the auditor’s report if it is unqualified, the table of contents, the cover-page address list, and the exhibit index. Experienced investors on investing forums repeat one instruction constantly, and it is worth following sooner or later: always read the footnotes. That is usually where a change in revenue recognition, a contingent liability, or a related-party deal shows up.
How to Read Revenue, Earnings, and Profitability
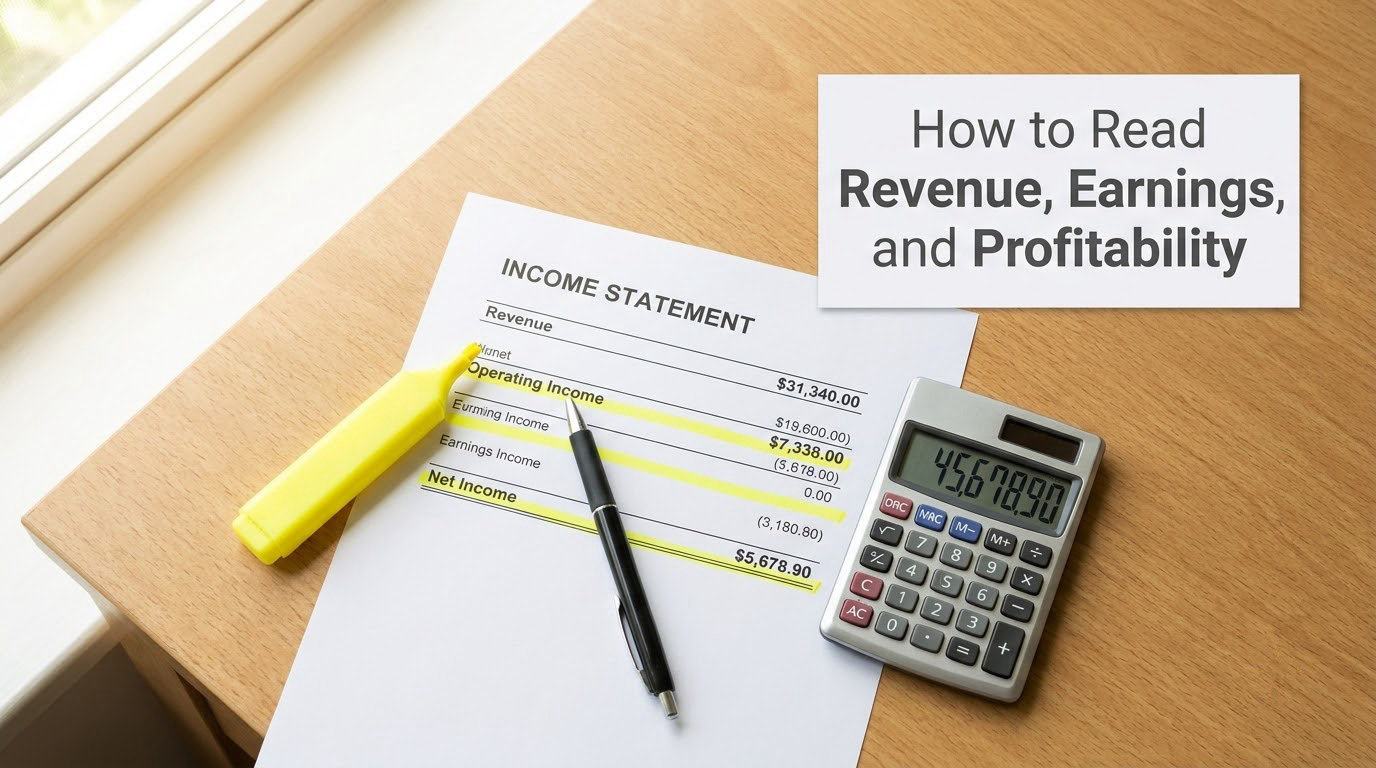
Revenue growth is the first question, and the right comparison is year-over-year rather than quarter-over-quarter. Quarterly revenue swings with holidays and weather; comparing this quarter to the same quarter last year smooths that out.
Then work down the income statement. Each line tells you something different about why the profit number looks the way it does.
| Measure | What it tells you | What to watch |
|---|---|---|
| Revenue | Total sales for the period | Growth rate, and whether growth came from price or volume |
| Gross profit and gross margin | What is left after direct costs | Falling gross margin usually means rising input or shipping costs |
| Operating income and operating margin | Profit from running the business, before interest and tax | Whether spending on staff, sales, and research is under control |
| Net income | Profit after interest, tax, and one-time items | Effective tax rate swings that make profit hard to compare |
| EPS | Net income divided by diluted shares | Whether the share count is shrinking from buybacks |
Two EPS figures usually appear, and they are calculated differently. GAAP EPS follows the accounting rules the company must use. Adjusted, or non-GAAP, EPS strips out items management considers unusual, such as restructuring charges, acquisition costs, or stock-based compensation.
Read the gap between them rather than the headline. When a company reports a GAAP loss and an adjusted profit, the exclusions are doing all the work. Stock-based compensation is a real cost to shareholders because it dilutes their ownership, and at many technology companies it runs well into double digits as a share of revenue.
A simple arithmetic check catches most cases. Divide net income by the diluted share count yourself. If your figure differs a lot from the adjusted number on the first page, the press release is leaning on exclusions.
How to Read the Balance Sheet and Cash Flow Statement
The income statement tells you what happened during the period. The balance sheet tells you what the company owns and owes at the end of it, and it is where a comfortable earnings report can still turn into a problem.
Four checks are worth making every time. Compare cash and short-term investments against debt coming due within a year. Look at inventory against revenue; inventory growing much faster than sales often signals unsold stock. Watch receivables, which rise when revenue is booked but cash has not been collected. And skim the equity line, because steadily shrinking shareholder equity from buybacks funded by debt changes the risk profile of the whole business.
The cash flow statement is the real test of earnings quality. Operating cash flow shows the cash generated by running the business. Capital expenditures show the cash spent on property, equipment, and infrastructure. Free cash flow is the first minus the second, and it is what is genuinely available to shareholders after keeping the lights on.
Compare operating cash flow with net income over several quarters. Persistent profits with weak cash flow mean the revenue is not being collected or the company is recognising revenue early. Occasional gaps happen because of timing and are not a problem on their own.
Companies that report strong profits every quarter and consistently poor free cash flow are worth understanding before you trust the trend. It usually means growth is being funded by working capital rather than by the business itself.
How to Read Management Guidance and Earnings Calls
Guidance is management’s forecast for future revenue and earnings, and it carries more weight than the quarter just reported. Markets are forward-looking, which is why a company can beat its estimates, raise nothing, and still see its shares fall.
Compare three things rather than one. How did actual results land against the consensus estimate that analysts agreed on beforehand. How does the new guidance compare with the guidance given last quarter. And what happened to the reason management gave, because “macro headwinds” and “timing” are usually softer than they sound.
The earnings call is where that reasoning gets tested. Prepared remarks repeat the release, so the useful part is the question and answer session. Listen for questions that get vague answers, analysts repeating the same concern twice, or the chief executive taking over every answer from the chief financial officer. Repetition in the Q&A is often where a weak spot is known but not yet disclosed.
Transcripts are usually free on the company’s investor relations page within a day or two of the call, so listening live is optional rather than necessary.
How to Compare an Earnings Report With Previous Results
One quarter is a data point. Four to eight quarters make a trend, which is why the annual report is more useful for a beginner than any single release.
| Fiscal quarter | Period end on a calendar year | Typical reporting window |
|---|---|---|
| Q1 | March 31 | Mid-April to mid-May |
| Q2 | June 30 | Mid-July to mid-August |
| Q3 | September 30 | Mid-October to mid-November |
| Q4 | December 31 | Late January to mid-February |
Not every company uses a calendar fiscal year. Retailers often do not, because their busiest period ends in the autumn; Walmart’s fiscal year ends on January 31, so its Q4 covers February through January. Always check the period dates printed on the report before comparing two companies quarter by quarter.
Reporting frequency also differs by jurisdiction. US companies file quarterly. UK and Australian companies commonly report half-yearly rather than quarterly, so there is simply less frequent data to read.
When comparing periods, adjust for the things that distort them. Acquisitions add revenue that the company did not organically earn. Seasonality makes holiday quarters useless as a comparison base. A change in accounting method can restate a prior period. One-time charges, tax benefits, and legal settlements belong in your notes rather than in the trend line.
The comparison that carries the most information is actual results against what the company itself guided to last quarter. Beating your own guidance consistently means management is conservative and probably will not cut guidance. Missing it repeatedly is a warning about the forecast, not just the quarter.
Key Numbers and Terms to Check Before Investing
Before a decision, run through this short list. It takes five minutes and catches most of what matters.
- Revenue growth year-over-year, and whether it came from price increases or more units.
- Gross and operating margin direction across at least four quarters.
- Operating cash flow against net income for the same period.
- Free cash flow after capital expenditure, and whether it funds the dividend.
- Cash and short-term investments against near-term debt.
- Inventory and receivables relative to revenue.
- Diluted share count and the effect of any buyback or stock-based compensation.
- The size of the gap between GAAP EPS and adjusted EPS.
- Whether guidance was raised, held, or lowered, and the reason given.
- Any new risk factor language in the filing.
| Term | Plain meaning |
|---|---|
| Consensus estimate | The average analyst prediction the market expects to beat or miss |
| GAAP | The standardised accounting rules a US company must follow when reporting |
| Diluted shares | The share count including options and awards, which lowers EPS |
| Free cash flow | Operating cash flow minus capital expenditure |
| MD&A | Management discussion and analysis, the narrative explaining the numbers |
| EBITDA | Operating profit before interest, tax, depreciation, and amortisation |
| Working capital | Current assets minus current liabilities, the short-term cushion |
Be honest about the limits here. Reading a report well tells you how a business is doing. It does not tell you what the share price will do next quarter, and no process reliably does.
Common Mistakes When Reading Earnings Reports
Fixating on EPS alone. EPS can rise simply because a company bought back shares, even when revenue and profit are flat. Always read revenue first.
Ignoring the cash flow statement. Profit is an accounting estimate; cash is what actually arrived. Persistent divergence between the two deserves an explanation.
Treating guidance as a promise. It is a forecast issued by the people with the least incentive to be wrong about their own business. Read it as a probability, not a fact.
Overlooking the debt on the balance sheet. A profitable company with a near-term maturity wall can be in far more trouble than the earnings release suggests.
Comparing unlike periods. Holiday quarters, non-calendar fiscal years, and acquisitions make careless comparisons meaningless. Check the dates.
Trusting adjusted figures over the statutory ones. Adjusted earnings are useful for comparing trends, not for valuing a business, because the excluded costs are usually recurring.
Stopping at the press release. The interesting material is in the MD&A and the footnotes, which is exactly why experienced readers go straight there.
Frequently Asked Questions
Where can I find company earnings?
Public company earnings are filed free with the SEC in EDGAR, the database at sec.gov. Search the company name, open its filings list, and filter by form type for 10-Q, 10-K, or 8-K. The company investor relations page is faster and usually hosts the press release, slides, and a free earnings call transcript. Outside the US, equivalents include SEDAR in Canada and the ASX announcements platform in Australia.
What is Q1, Q2, Q3 and Q4 in a financial year?
A fiscal year splits into four quarters: Q1 covers the first three months, Q2 the second, Q3 the third, and Q4 the fourth. On a calendar year, Q1 ends March 31, Q2 June 30, Q3 September 30, and Q4 December 31. Many retailers use a different fiscal year, so check the period dates on the report before comparing companies quarter by quarter.
How do earnings reports affect share prices?
Reports move individual shares far more than most economic data does, with average moves often in the 5 to 7 percent range. The reaction depends on how results compared with what analysts already expected, plus the change in guidance. A beat with lowered guidance can still send a share down, because the forward numbers matter more than the quarter just reported.
How do I interpret earnings per share?
Earnings per share is net income divided by the diluted share count. A higher figure means more profit per share, but it is only comparable across companies when calculated the same way on a GAAP basis. Adjusted EPS, which excludes items management calls unusual, is not comparable. Watch the share count too, because buybacks lift EPS even when total profit is unchanged.
What is the difference between GAAP EPS and adjusted EPS?
GAAP EPS follows the accounting rules a company must use, so it includes stock-based compensation, restructuring, and acquisition costs. Adjusted EPS removes those items, which makes results look cleaner and easier to compare with forecasts. The exclusions are sometimes genuinely one-off, but stock-based compensation is a recurring dilution cost, so a wide gap deserves attention.
How long does it take to read an earnings report?
Fifteen minutes covers the useful parts if you start with the press release: about five minutes for revenue, EPS, and guidance, two each for margins and cash flow, two for a balance sheet scan, and four for the guidance change and call transcript. Reading every footnote takes hours, which is why experienced investors read them selectively, focusing on accounting changes and contingencies.
Conclusion
Knowing how to read an earnings report comes down to a fixed sequence: revenue first, then margins, then cash flow, then the balance sheet, then guidance and the call. Beat and miss headlines are the least informative part of the document.
Start with one action. Pull the official press release for a company you already own, check revenue against the same quarter last year, compare operating cash flow with net income, and read what management said about the coming quarter. If any of those numbers surprise you, go to the filing and find the explanation in the MD&A and the footnotes before you decide anything.
None of this is investment advice, and no reading method turns a report into a reliable prediction. What it does give you is a repeatable process, which is more than most shareholders have when the share price moves the morning after results.