
The price to earnings ratio explained for beginners comes down to one number: divide a stock’s share price by its earnings per share and you get an earnings multiple that tells you how many dollars you pay for each dollar of annual profit. It is the fastest way to compare two companies of very different sizes, and the easiest way to mislead yourself if you use it alone.
This guide is for education only. Nothing here is investment advice, and no particular security is recommended. Valuation multiples move with market sentiment and each investor’s goals and circumstances are different, so treat everything here as a tool for thinking, not a signal to act.
Table of Contents
- What Is the Price to Earnings Ratio?
- How to Calculate the Price to Earnings Ratio
- Worked calculation
- How to Interpret P/E Ratios
- Why P/E Ratios Differ Across Companies
- Trailing P/E vs. Forward P/E
- P/E Ratio Examples for Beginners
- What a P/E Ratio Does Not Tell You
- Negative P/E and cyclical earnings
- Accounting and one-off items
- What sits outside the ratio
- How to Use P/E in a Beginner Investing Process
- Where to find the number
- Frequently Asked Questions
- What did Warren Buffett say about the P/E ratio?
- What is a really good P/E ratio?
- Is a P/E ratio of 25 good or bad?
- Is 40 a good P/E ratio?
- What does a negative P/E ratio mean?
- How do you calculate the P/E ratio?
- Conclusion
What Is the Price to Earnings Ratio?
The price to earnings ratio, usually written P/E, is a valuation metric that divides a company’s current share price by its earnings per share. If a stock trades at 150 dollars and earns 6 dollars per share, the P/E is 25. You are paying 25 dollars for every 1 dollar of yearly profit the company generates.
Two inputs go into it. The share price is what the market charges right now for one share, and it moves every second. Earnings per share, or EPS, is the portion of a company’s net income that belongs to one share, calculated by dividing net income by shares outstanding.
Earnings per share (EPS) in one line: all the profit the company kept after costs, divided by the number of shares in issue. Net income of 300 million dollars across 100 million shares gives an EPS of 3 dollars.
The intuition is simple. A P/E is a price tag expressed in units of profit rather than dollars, which is why two stocks trading at 40 and 8 dollars can be compared fairly. A company that earns 2 dollars per share at a 40 dollar price carries a P/E of 20, while one earning 4 dollars per share at the same 40 dollar price carries a P/E of 10. The second company is cheaper on this measure, though whether it deserves to be is the whole argument.
How to Calculate the Price to Earnings Ratio
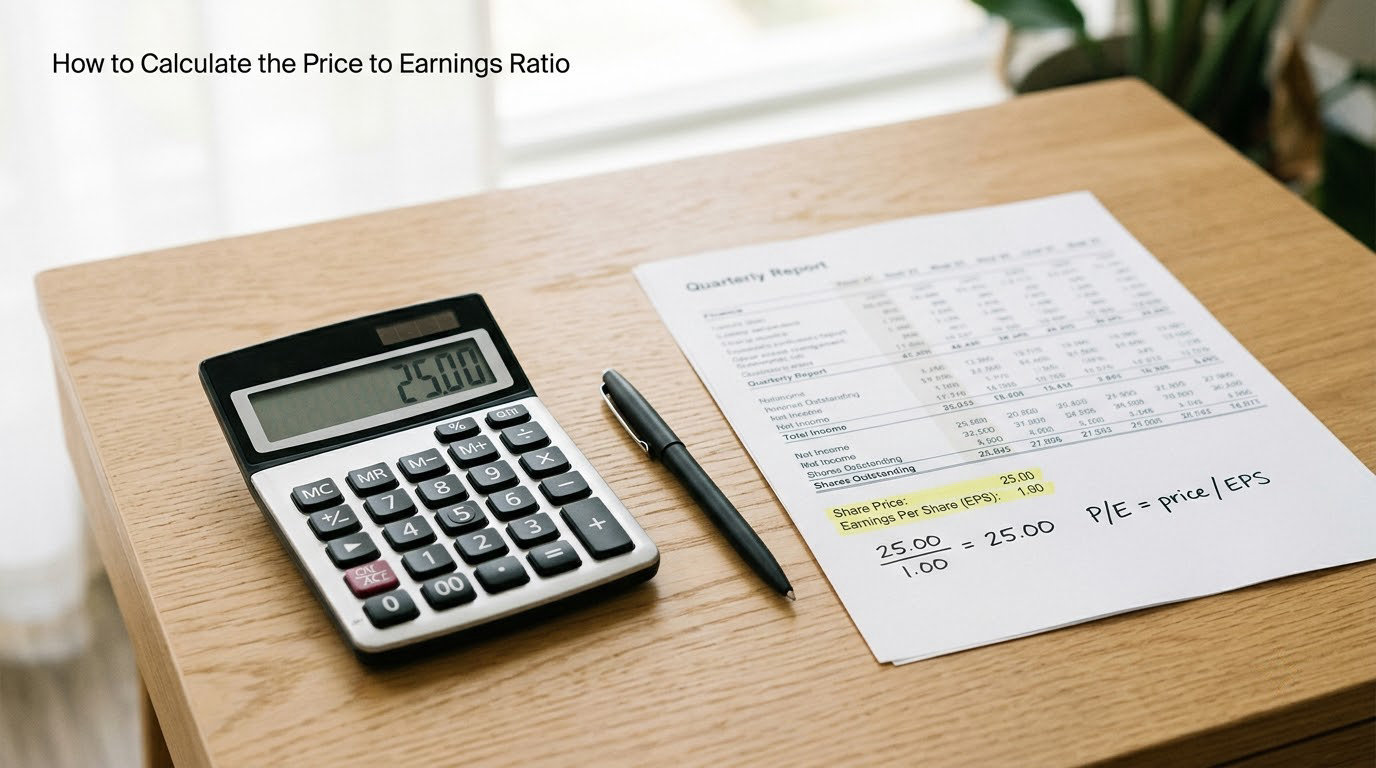
The formula takes one line:
P/E ratio = Share price per share ÷ Earnings per share (EPS)
Share price is the current market price of one share. EPS is either the trailing twelve months figure, the sum of the last four reported quarters, or a forward estimate based on analyst consensus for the next twelve months.
Worked calculation
A grocery chain has a share price of 82 dollars. Over the last four quarters it earned a net income of 900 million dollars, and it has 60 million shares outstanding. So EPS is 900 million ÷ 60 million = 15 dollars, and the P/E is 82 ÷ 15 = 5.5. That is 5.5 dollars paid for each dollar of yearly profit.
The arithmetic is only the easy part. You have to use figures from comparable periods, which is where beginners slip: dividing today’s price by an EPS number that already includes a one-off gain, or by a number pulled from an annual report while ignoring the most recent quarter, produces a number that looks precise and means nothing.
There is also a market capitalisation route to the same answer. Multiply share price by shares outstanding for market cap, multiply net income by shares outstanding per share for EPS, and the share count cancels out. That version is handy when you want a whole-company view, but the per-share version is the one screens show.
How to Interpret P/E Ratios
Read the number as a price for profit, then ask what profit you expect to last and how confident you are. A P/E of 8 means you pay 8 dollars for a dollar of current earnings, which usually signals caution from the market about durability, growth, or balance sheet health. A P/E of 35 means the same dollar of profit costs 35 dollars, which usually signals the market expects much more profit later.
Neither end of the range is automatically wrong. What matters is the comparison set, so you should always read a multiple against three reference points: the company’s own history, the sector average, and the broad market level.
| Reading | What it usually signals | What to check next |
|---|---|---|
| Below 10 | Market expects weak or falling earnings | Is sales revenue shrinking, and is the debt load rising? |
| 10 to 20 | Mature business with modest growth | Compare with the sector average and the company’s own 5-year range |
| 20 to 30 | Steady growth priced in | Is the earnings growth rate at least matching the multiple? |
| Above 30 | High growth expectations or optimism | Ask whether growth can realistically continue for years |
| Negative | Loss-making over the period used | The multiple is meaningless; look at cash flow instead |
It helps to invert the number. Dividing 1 by the P/E gives the earnings yield, and because it always sits below 1 in percent terms it is easier to compare across stocks and with bond yields. A P/E of 20 is an earnings yield of 5 percent, while a P/E of 40 is 2.5 percent. When the earnings yield on a stock is thinner than what you can get from a short bond, you are paying for growth or accepting risk.
Why P/E Ratios Differ Across Companies
A software company and a water utility will never trade at the same multiple, and that is not an inefficiency. It reflects different economics. A utility earns predictable cash flow with almost no growth, so investors demand a low multiple, usually in the low teens or below. A software company can grow earnings quickly, so investors pay more for each dollar of today’s profit.
Other drivers stack on top. Profitability matters, because a business with thin or negative margins has fragile earnings that deserve a discount. Interest rates matter, since higher rates push up the value investors demand from a future earnings stream. Balance sheet risk matters too, and heavily indebted companies carry a lower multiple than comparable firms with net cash.
Market sentiment feeds in as well. Multiples tend to expand during bull markets and compress during bear markets, so the same stock can move 20 percent in a year while its P/E barely changes. It is worth remembering that the multiple is a measure of how investors currently feel about the earnings, not a fixed property of the business.
Trailing P/E vs. Forward P/E
Most ratios you see are built from one of three earnings bases, and each answers a slightly different question.
| Type | Earnings used | Strength | Weakness |
|---|---|---|---|
| Trailing P/E | Actual earnings from the last 12 months | Uses facts, not forecasts | Can look cheap right after a peak and expensive at a trough |
| Forward P/E | Analyst estimates for the next 12 months | Reflects the growth investors expect | Built on estimates that are revised often |
| Shiller (CAPE) | Average inflation-adjusted earnings over 10 years | Smooths out business cycles | Very slow moving, better for index-level context |
The practical difference is timing. A forward P/E of 12 sitting beside a trailing P/E of 18 tells you analysts expect earnings to grow roughly a third. But those estimates move. Guidance issued with quarterly results, a weak quarter, or a downgrade from an analyst can push the forward figure up sharply without the share price changing at all, which is why forward multiples can look cheap right before a company disappoints.
Trailing P/E has the mirror problem. During an economic slowdown, reported earnings fall and the trailing multiple jumps, making a healthy business look expensive at exactly the wrong moment. Experienced readers often look at both, and treat the gap between them as the growth assumption baked into the price.
P/E Ratio Examples for Beginners
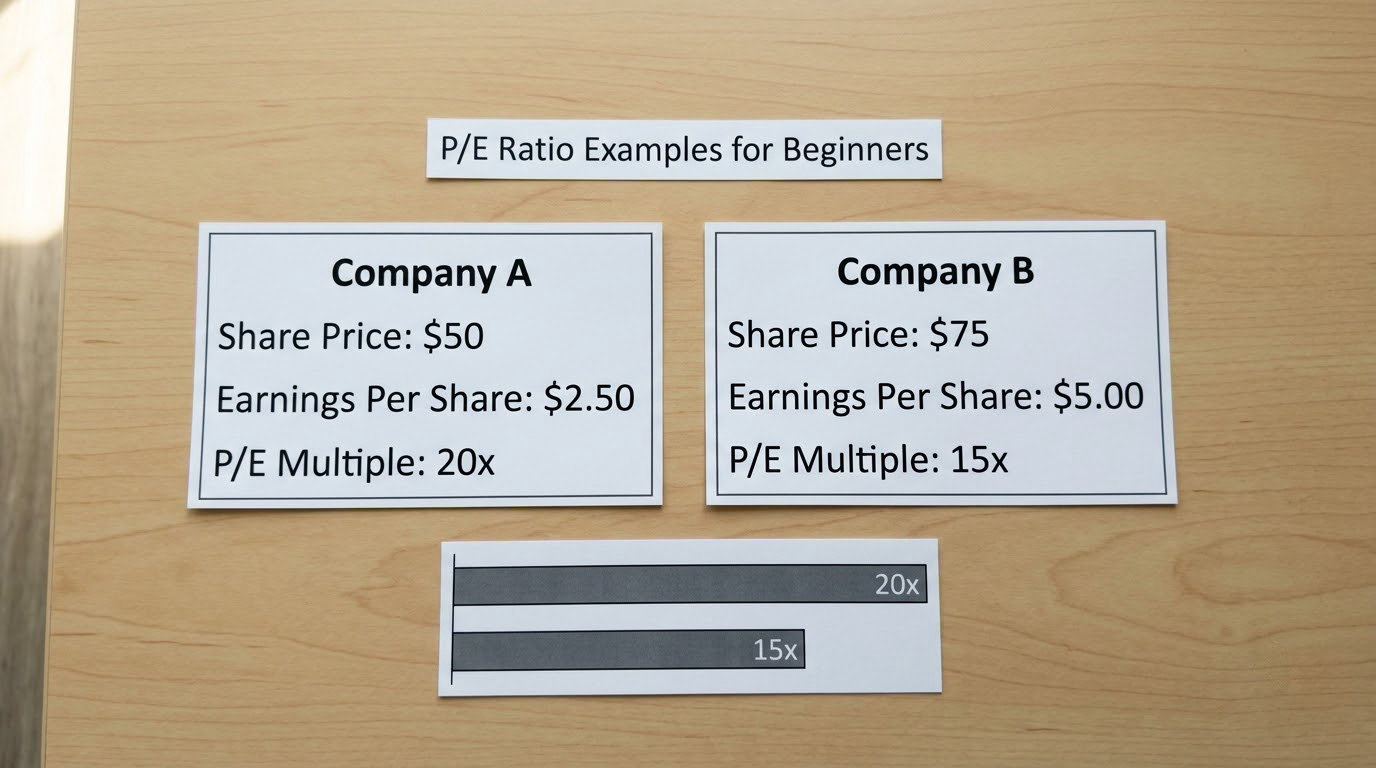
Take two hypothetical food manufacturers. Company A trades at 60 dollars with EPS of 3 dollars, a P/E of 20. Company B trades at 45 dollars with EPS of 4.50, a P/E of 10. On the multiple alone, B looks like the obvious bargain.
Now add the context. If Company B’s revenue has fallen for three straight quarters and it carries net debt equal to four times annual earnings, that P/E of 10 is not a discount, it is a warning. If Company A grows earnings by 12 percent a year with steady margins and no debt, a P/E of 20 may be reasonable for that durability.
The habit worth building is to compute the multiple and then immediately ask what it assumes. A high multiple is a statement about future growth. A low multiple is a statement about present risk. Neither statement is a verdict, and the numbers that change the answer are the growth rate, the balance sheet, and the reliability of the earnings themselves.
What a P/E Ratio Does Not Tell You
The formula is clean, and that is part of the problem. It flattens everything that makes companies different.
Negative P/E and cyclical earnings
When a company loses money, EPS is negative, so the P/E is negative, which means nothing. A negative figure on your screen means the denominator is unusable, not that the company is cheap. The same applies in a milder form to cyclical businesses: an oil producer or a chip maker can show a P/E of 6 at the top of a cycle and 60 at the bottom, using the same share price and no real change in the business.
Accounting and one-off items
EPS is built from reported net income, and reported net income is shaped by accounting choices, impairments, tax settlements and asset sales. Two companies with the same cash generation can show different EPS, which produces different P/Es for reasons that have nothing to do with what a shareholder owns.
What sits outside the ratio
Debt never appears in the formula, yet a company carrying heavy interest costs can be wiped out at the same earnings level as one that owes nothing. Free cash flow is absent too, so a firm that books earnings but spends them all on capital equipment looks identical to one that converts profit into distributable cash. Return on equity and margins are excluded as well, which means a P/E tells you nothing about how efficiently the business uses the capital behind it.
The honest framing, which is also the most common point raised by experienced investors on finance forums, is that P/E is a screening input rather than a decision tool. It tells you where to ask questions. It does not answer them. Several of the recurring beginner questions online are really the same question in different clothes: whether some ideal multiple exists, and the answer is no, because every industry carries its own range.
How to Use P/E in a Beginner Investing Process
Work through these five steps before the number changes anything about your thinking.
- Verify the earnings figure. Confirm which EPS was used, whether trailing or forward, and from which filing or estimate period it came.
- Check that the company has positive, real earnings. If EPS is negative or heavily distorted by one-off items, drop the P/E and use cash flow instead.
- Compare only within a similar set. Use peers with comparable growth, margins, capital intensity and risk. A software firm and a regional bank are not peers.
- Compare against the company’s own history. A stock at 30 times earnings when it has traded between 12 and 18 for five years is telling you something specific about expectations.
- Read the other numbers next to it. Revenue trend, operating margin, debt, free cash flow and dividend cover turn a single multiple into a picture.
Where to find the number
On most broker platforms and quote pages, the ratio sits in the statistics or fundamentals tab, often labelled PE, P/E, trailing P/E or P/E (TTM). If a screen lets you filter by it, look for the field called trailing P/E and confirm the figure matches what the company page shows. Screens let you set a range, which makes sector comparison faster: filter to one industry, sort by trailing P/E, then read the business descriptions of the cheapest names rather than buying the lowest one on the list.
One habit that pays off quickly is saving a company’s P/E each quarter in a spreadsheet so you can see its own range instead of guessing. It takes five minutes a month and it answers the question beginners ask most often, which is whether today’s number is high or low for this company.
Frequently Asked Questions
What did Warren Buffett say about the P/E ratio?
Buffett has repeatedly criticised using a single P/E number to judge a company, saying a ratio that ignores debt, growth and business quality describes little of value. His stated preference has been to buy businesses based on expected future cash flows rather than on a multiple applied to one year of earnings. The practical takeaway for beginners is that the ratio is a starting question, not an answer.
What is a really good P/E ratio?
There is no universal number that counts as good, because every sector has its own range and every company has its own history. Mature utilities and banks often trade in the low teens, established industrials around 15 to 20, and profitable software companies far higher because growth is expected. A good P/E for you is one that sits below the level implied by the growth and durability you genuinely believe the business has.
Is a P/E ratio of 25 good or bad?
It depends entirely on what you are comparing it to. A P/E of 25 is rich for a utility or a bank, where growth is slow and returns are stable, and entirely ordinary for a large software company growing earnings at double digits. Check it against the sector average, against the company’s own five-year range, and against its growth rate before treating it as expensive or cheap.
Is 40 a good P/E ratio?
A P/E of 40 means you pay 40 dollars for a dollar of current profit, so the price only makes sense if earnings grow fast and keep growing for years. Many durable businesses do, which is why high multiples persist in the market for long stretches. If growth is expected to slow to single digits, a multiple that high leaves very little room for disappointment.
What does a negative P/E ratio mean?
A negative P/E means earnings per share was negative over the period used, so the company lost money in that window. The ratio is mathematically meaningless and the negative sign is not a signal of cheapness. Look at how long the losses have lasted, how much cash the business consumes, and whether it has a realistic path back to positive earnings before relying on any multiple.
How do you calculate the P/E ratio?
Divide the current share price by earnings per share. If a stock trades at 150 dollars and reports 6 dollars of earnings per share over the last four quarters, the P/E is 25, meaning you pay 25 dollars for each dollar of annual profit. Use a trailing EPS for facts you can verify, or a forward estimate for analyst projections, and always make sure both numbers refer to a comparable period.
Conclusion
The P/E ratio is a translation tool. It turns two very different price and profit scales into one comparable number, and it tells you how optimistic or cautious the market currently is about a company. It does not tell you whether the business is good, whether the price is right, or what to do next.
So start narrow: pick one company you actually understand, find its trailing twelve months EPS on a quote page, divide, and then compare that number with only two or three businesses whose growth, margins and balance sheets resemble it. Record the result and look again in three months. One ratio, compared properly and revisited over time, teaches more than a screen full of them.