
Understanding how the jobs report moves markets comes down to one idea: traders do not trade the payroll number itself, they trade the gap between that number and what they expected. That gap reprices interest rates, and rates are the discount rate applied to every future dollar of profit. The whole chain runs in seconds, and it is the same in every month of every year.
This guide walks the chain end to end, from the headline number to the sector that moves most. Nothing here is pinned to one release, because the mechanism does not change when the number does.
This is general educational information about how markets price economic data. It is not investment advice, and no forecast here is a recommendation. Rules, rates and market conditions change, so treat every example as mechanics to recognize rather than a prediction.
Table of Contents
- What Is the Jobs Report?
- How the Jobs Report Moves Markets
- Which Jobs Report Numbers Matter Most?
- Why Investors Care About Employment Data
- How the Jobs Report Affects Stocks
- How the Jobs Report Affects Bonds and Interest Rates
- Why a Strong Jobs Report Does Not Always Make Stocks Rise
- How to Interpret Revisions and Conflicting Signals
- What to Watch After the Release
- Frequently Asked Questions
- How does the jobs report affect the stock market?
- Why did the stock market drop after a good jobs report?
- Why is it bad when bond yields rise?
- Why does the dollar move after the jobs report?
- Can the Fed cut rates even when jobs are strong?
What Is the Jobs Report?
The jobs report is the US Bureau of Labor Statistics’ monthly release on employment conditions, published on the first Friday of every month at 8:30 a.m. ET. Its most-watched figure, nonfarm payrolls, counts jobs added outside farming, government, private households and nonprofits.

The report is built from two separate surveys, and knowing which number came from which survey explains most of the odd contradictions you see in the headlines.
The establishment survey polls employers, asking how many people are on their payrolls. Its nonfarm payrolls figure is the headline number because employers report actual tax payroll records rather than estimates of behavior, which makes it the more reliable of the two.
The household survey asks roughly 60,000 households whether anyone in the home is working, looking for work, or neither. That survey produces the unemployment rate and the labor force participation rate, and it is the slower, noisier series of the two.
Two more details matter more than they look. Every figure is seasonally adjusted, meaning the statisticians subtract an estimate of normal seasonal swings like holiday hiring. And the report has existed since the late 1930s, born out of the Great Depression, when mass unemployment made measurement a national priority.
How the Jobs Report Moves Markets
Markets move because the jobs report changes the expected path of interest rates. Every other reaction that day, including the bond sell-off, the dollar and the drop in a high-multiple software stock, is downstream of traders updating the odds on what the central bank does next.
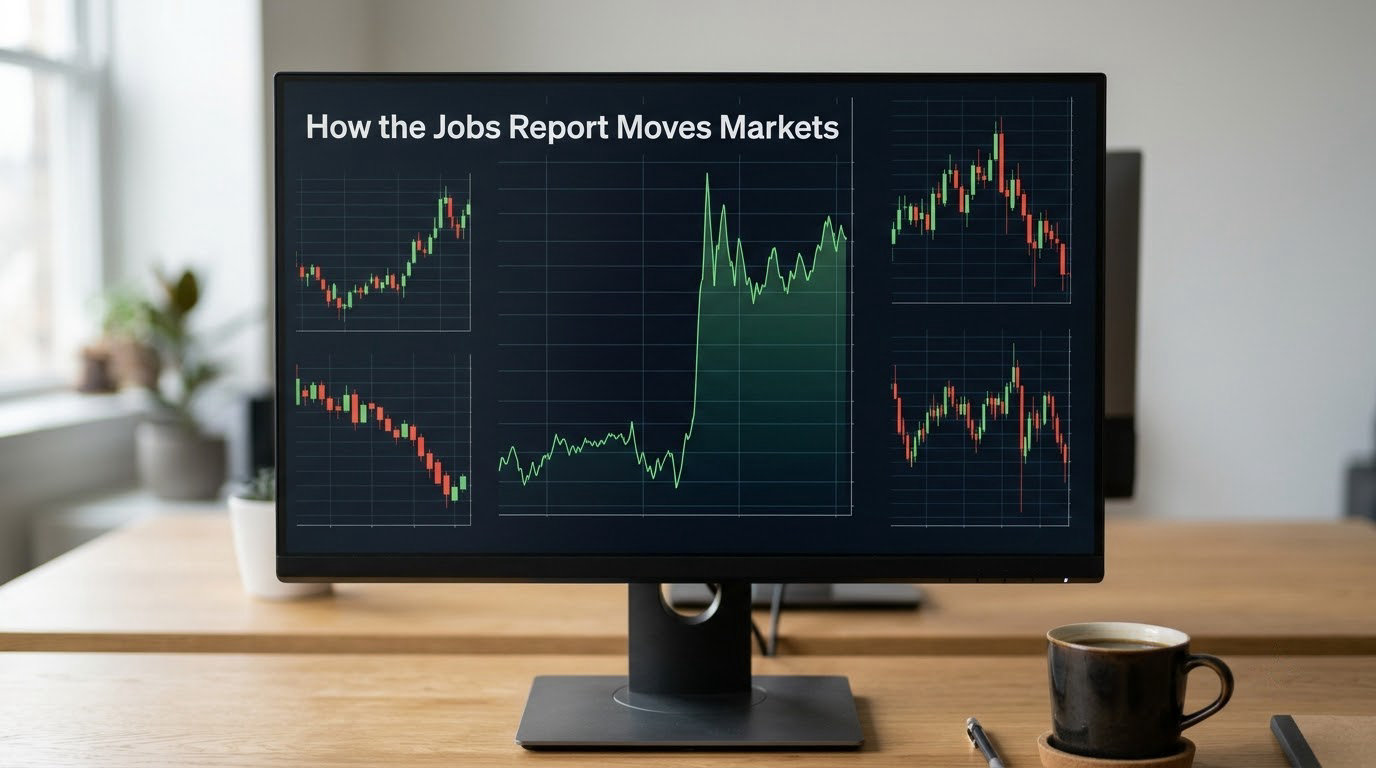
- The print lands and gets measured against expectations. The headline number is instantly compared with the consensus forecast collected from economists and banks. The gap between actual and expected, not the size of the number, is what carries information. A large gain that everyone predicted contains almost none.
- Rate expectations reprice within seconds. The most liquid expression of those expectations is the fed funds futures market, where contracts settle on where the overnight rate is expected to be at future dates. More jobs means the market prices a smaller chance of cuts, or a real chance of hikes. Contracts repricing at once is why futures can gap before the news conference even starts.
- The two-year Treasury yield moves first. It sits closest to the policy rate in duration terms, so it is the cleanest read on what traders think the central bank will do. Almost every immediate reaction you see in the first few minutes happens here.
- The ten-year follows only if inflation expectations shift. A hot payrolls print does not by itself lift long bonds. It moves the long end when average hourly earnings run hot, because wages are the largest single input into the cost of doing business. That is how a strong report can lift short yields and long yields together, or short yields alone.
- The dollar reacts to the rate gap. Higher expected US rates make dollar assets more attractive relative to assets priced in other currencies, so the dollar tends to firm on a hawkish print and soften when the report weakens the rate-cut case.
- Equity valuations adjust to the new discount rate. A stock’s price is a pile of future profits discounted back to today. Raise the rate used to discount those profits and the present value falls, which hurts the companies whose value sits furthest in the future. That is the entire reason a good number can produce a down day.
The practical takeaway: the report is not a verdict on the economy, it is an input into the rate path. Investors react to the rate path, and everything else follows.
Which Jobs Report Numbers Matter Most?
Eight figures inside the release do most of the work. Knowing what each one measures, and what it feeds into, turns a headline into an actual read.
| Measure | What it tells you | Why investors react |
|---|---|---|
| Nonfarm payrolls | Net jobs added outside the sectors the bureau excludes, measured by employer payroll records | The headline. Sets the base case for growth and for the rate path |
| Unemployment rate | Share of the labor force without a job and actively looking, from the household survey | A clean read on slack; a surprise here often matters more than payrolls |
| Average hourly earnings | Average hourly pay on nonfarm payrolls, with a separate series for the private sector | Feeds directly into the inflation question, and inflation is half of the central bank’s mandate |
| Labor force participation rate | Share of the civilian population either working or actively job hunting | A weak participation rate can flatter the unemployment rate by shrinking the denominator |
| Temporary help employment | Workers on temporary contracts, one of the earliest hiring signals in any cycle | Tends to turn before the rest of the labor market, so traders watch it as an early read |
| Average workweek and overtime | Hours per worker, which drives total payroll income | Income matters more than headcount for consumer spending |
| Revisions | Corrected figures for the prior one or two months | Chronic downward revisions undercut the headline and shift the trend, not just the month |
| Job openings | Unfilled positions reported by employers, published separately as JOLTS | Measures labor demand from the employer side; pairs with quits to show wage bargaining power |
Two habits separate readers who benefit from this report from readers who only react to it. First, look at the private payroll series, which is the cleanest signal on its own. Second, read the details before the headline, because the details are what the next release will be revised on.
Why Investors Care About Employment Data
Employment data sits at the center of how markets think about growth, inflation and policy at the same time. Payroll income is the fuel of consumer spending, consumer spending is most corporate revenue, and revenue is what the equity market capitalizes.
The connection is direct enough to use an example. Households earn roughly two-thirds of their income in wages and salaries, so a sustained slowdown in hiring shows up within a couple of quarters in spending at restaurants, in retail and in housing. Companies notice, cut forecasts, and margins follow. A forecast cut is what actually moves a stock price, and the jobs report is often the first public evidence that a cut is needed.
Wages matter for a second reason. If pay keeps climbing faster than productivity, labor costs feed into prices, which is exactly what the central bank is asked to control. That is why a strong jobs number with hot average hourly earnings is treated as a warning about inflation rather than a clean win for growth.
The Federal Reserve, the US central bank, has two targets in its mandate: maximum employment and stable prices. Employment data sits inside its job description. When traders see hiring holding up, they are not guessing about the weather, they are watching the data the policy decision will be made from.
How the Jobs Report Affects Stocks
The effect on equities runs through the discount rate, and because companies differ in how much of their value sits in the future, the same report moves different sectors in opposite directions.
| Sector | Typical rate sensitivity | How it tends to react to a hawkish print |
|---|---|---|
| Utilities | High | Often pressured. Steady cash flows are worth less when the safe alternative pays more |
| Real estate investment trusts | High | Usually hit hardest. They are leveraged property businesses financed with borrowed money |
| Semiconductors and high-multiple growth | High | The most visible losers. Profits sit furthest out, so they lose the most when discounted harder |
| Small caps | Medium to high | Squeezed, since they rely on floating-rate debt and have less profitable cushion |
| Banks | Medium | Two-sided. Wider lending margins help, but a flattening curve squeezes the shape of the curve they earn from |
| Cyclicals such as autos and travel | Medium | Supported when the print reads as healthy growth and weak consumer demand |
| Consumer staples | Low | Moves least. Demand is stable whether or not the cycle turns |
Index-level moves follow from how those pieces weigh. A broad index can rise on strong reports when growth expectations improve faster than discount rates rise, which is the outcome investors call a soft landing. It can fall on the same report when the discount-rate effect dominates.
Options markets price this in advance. Implied volatility on the S&P 500 tends to drift up in the days before a release and collapse afterward, because the uncertainty has a known expiry. That is why many experienced investors do something close to nothing on release day.
How the Jobs Report Affects Bonds and Interest Rates
Bonds are the transmission mechanism, not a side effect. A bond’s price moves opposite to its yield, and the jobs report changes the yield investors demand for lending money over two or ten years.
The split between the front end and the long end explains a lot of confusing headlines. The two-year yield tracks policy expectations almost one for one, so it jumps on any change in the rate path. The ten-year reflects expected inflation and growth over a decade, so it needs more than a payrolls surprise to move.
When both ends rise together, traders call it a bear flattening or a bear steepening depending on which end moves more. Both names sound worse than they are. They only describe the shape of the move.
It helps to split yields into two pieces: the real yield, which is the return you actually keep after inflation, and the breakeven, which is the compensation investors want for expected inflation. A jobs report with hot wages tends to lift the breakeven part. A report with a soft landing read tends to push the real part up. When the real part rises, long-duration assets suffer most, which includes both long bonds and high-multiple stocks.
One more thing surprises beginners: yields can rise while stocks fall. That is not a contradiction. It happens when the market decides the growth news is not worth the higher rates, or when a rate-driven repricing is happening in both markets at once. Weak demand pushes yields down; a hot labor market pushes them up, and the second case is exactly what a hawkish jobs print produces.
Why a Strong Jobs Report Does Not Always Make Stocks Rise
A strong jobs report can sell off stocks because markets care about the surprise, not the level, and because they care about rates more than growth when rates are the problem.
Three conditions have to line up for the confusing outcome. The number has to beat expectations, the wage figure has to be hot, and traders have to already believe the economy is good enough. Miss any one of them and a strong print is usually received as reassuring.
The cycle context matters more than most commentary admits. During a hiking cycle, good employment news is hawkish news because the market is waiting for proof that inflation is cooling. During a cutting cycle, the same number is read as confirmation that the economy can absorb cuts. The identical headline produces opposite trades depending on what the market already wants.
| Period | What printed | How markets reacted | Why |
|---|---|---|---|
| Early 2018 | Payrolls far above forecasts, with a jump in wage growth | The Dow fell about 666 points in a session | Rapidly rising inflation fears pushed rate expectations up sharply |
| October 2024 | A large payroll beat paired with a lower unemployment rate | The S&P 500 jumped close to 3 percent in a day | The print strengthened the soft-landing story and rate-cut odds rose sharply |
| November 2024 | Payrolls near zero, distorted by storms and a strike, with unemployment ticking up | The Dow posted its largest single-day point gain on record | The Fed was widely expected to keep cutting, so weak jobs pulled cuts forward |
Two of those three rows are the same lesson. The market was trading the rate path, not the labor market.
There is a genuine counter-argument too. Weak hiring is not automatically bearish for stocks. A soft number that removes the fear of an imminent recession can produce a rally, and if the rest of the data stays stable, a gradual cooling is the outcome equities like most. The rule is simple: the market punishes surprises in both directions, and it cares about the path of rates more than the state of employment on its own.
How to Interpret Revisions and Conflicting Signals
The first print is a preliminary estimate that gets corrected for the next two months, so treat any single month as provisional rather than settled.
There are two kinds of revisions, and they mean different things. Monthly revisions are routine sampling corrections to the prior month or two. A benchmark revision is the bigger event, when the bureau re-estimates the entire history with new population controls and survey methodology. Benchmark revisions have historically pushed the previously reported level of employment down, which is why a chart that looks strong can still be revised into a weaker-looking trend.
A useful rule: compare three consecutive releases, not one. The direction of the trend matters more than any single figure, and it is the trend that survives revision.
Conflicting signals are normal, and here is how to resolve the common ones. If payrolls are strong but the participation rate falls, part of the employment change may be people leaving the labor force rather than finding work. If payrolls are weak but the unemployment rate falls, the labor force itself may be shrinking. If wages rise while hours worked fall, total income can be flat even though every worker got a raise.
The broadest measure to check before reacting is total payroll income, which combines headcount with hours and wages. It is the number closest to what consumers actually have to spend.
Finally, separate signal from noise. One month inside the normal range of variation tells you very little about a labor market that moves with the seasons. Decisions built on a single release are decisions built on a coin flip.
What to Watch After the Release
The ten minutes after 8:30 a.m. tell you what the market thought, and the rest of the month tells you whether it was right. Here is the sequence I would follow.
First, watch the two-year Treasury yield rather than the ten-year. It carries the cleanest signal about the rate path, and it moves first.
Second, check where implied volatility sits afterward. A collapse in volatility tells you the uncertainty is resolved. Elevated volatility that persists usually means the market disagrees with the headline read.
Third, look at sector leadership. If defensives outperform after a hot print, the market read it as hawkish. If cyclicals and small caps lead, it read the print as healthy growth.
Fourth, watch the dollar alongside equities. A strong dollar with falling yields is a growth-scare read. A strong dollar with rising short yields is a hawkish policy read. The two look similar on a headline and mean opposite things.
Fifth, follow up with the releases that confirm or contradict it. Job openings and quits show labor demand and wage bargaining power, consumer price data shows whether wages are turning into inflation, and personal spending data shows whether the income is being spent.
Last, keep your time horizon in front of you. The monthly report is one noisy input among dozens, and a portfolio built on long-term savings and diversification should not be repositioned on a single Friday morning. For everyone else, understanding the chain is most of the advantage available.
Frequently Asked Questions
How does the jobs report affect the stock market?
It changes what traders expect the Federal Reserve to do. Strong hiring pushes rate-cut odds down and rate-hike odds up, which lifts short-term Treasury yields, raises the discount rate applied to future profits, and pressures the highest-valued stocks. Weak hiring does the reverse. The reaction usually shows up within seconds of the 8:30 a.m. release.
Why did the stock market drop after a good jobs report?
Because markets trade the gap between the actual number and the one they expected, and they care more about rates than growth. A big payroll beat tells traders the economy is strong enough that the central bank can stay restrictive. Higher expected rates mean a higher discount rate on future profits, and the stocks with the most distant profits lose the most value.
Why is it bad when bond yields rise?
Bond prices move opposite to yields, so rising yields mean falling prices for existing bonds. More importantly, yields set the discount rate investors use everywhere else. Higher yields lower the present value of distant profits, which hurts long-maturity bonds most and long-duration stocks next. That is the channel through which a hawkish jobs print reaches your portfolio.
Why does the dollar move after the jobs report?
The dollar reacts to relative expected interest rates. A stronger-than-expected labor market makes investors expect higher US rates, and dollar assets become more attractive than assets priced in other currencies. That demand pushes the dollar up. When a weak report pulls rate-cut expectations forward, the same mechanism usually pushes it down.
Can the Fed cut rates even when jobs are strong?
Yes, because the Fed has two targets and inflation is usually the binding one. If price pressure is cooling even as payrolls hold up, the central bank can ease without reading the labor market as broken. Investors judge this by watching wage growth and inflation data alongside payrolls. A cut with strong employment is often read as confidence, not panic.
The one thing to take away is simple: the jobs report is not good news or bad news on its own. It is an input into the expected rate path, and everything that follows, from the two-year yield to the dollar to the last stock on the screen, is priced off that path.
So the next time you see a big payroll number and the market moves the other way, start at step two rather than the headline. If you only remember one line about how the jobs report moves markets, make it this: check where the two-year yield went, then check the cycle you are in. That order will explain more than the payroll figure ever will.