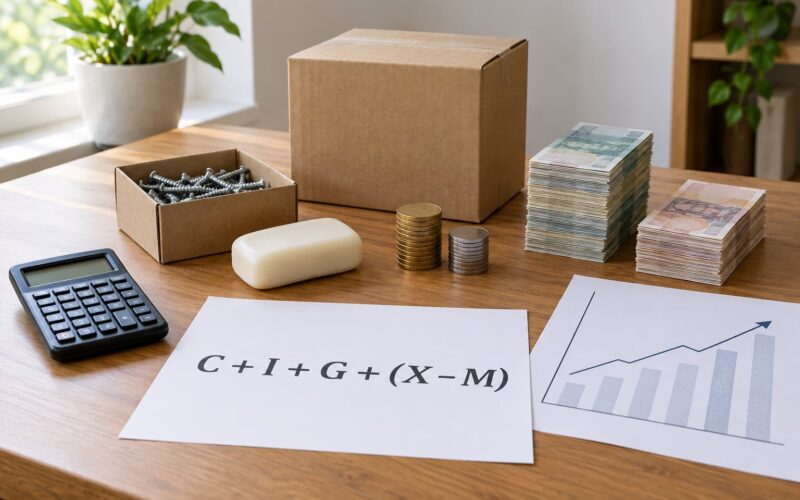
The Consumer Price Index is measured by the Bureau of Labor Statistics: the agency builds a representative market basket of goods and services urban households buy, records prices for roughly 80,000 items every month, and divides the current cost of that basket by its cost in the base period of 1982 through 1984, then multiplies by 100. The percent change in that index number, not the number itself, is the inflation rate you hear reported.
The catch is that no household buys the average basket. Your spending mix, your city, and whether you rent or own all change what your own inflation looks like compared to the national headline. That gap is where most of the confusion comes from, so it gets its own section below.
Table of Contents
- What Does the Consumer Price Index Measure?
- CPI versus inflation
- Who produces it
- CPI versus the PCE price index
- What Is in the CPI Basket?
- How the Consumer Price Index Is Measured Step by Step
- What Do the CPI Categories and Weights Mean?
- How Does the Bureau of Labor Statistics Collect Prices?
- Who is counted and who is not
- Why Can the CPI Differ from What One Household Experiences?
- How Is the CPI Used in Personal Finance and Investing?
- Frequently Asked Questions
- How often is the CPI released, and where can I read the raw data?
- Does the CPI measure the cost of living for one exact household?
- What is the difference between the Consumer Price Index and inflation?
- How are quality changes handled when a product changes?
- Why is the CPI often criticized as inaccurate?
- Does the CPI ever go negative?
- What to Take Away About the CPI
What Does the Consumer Price Index Measure?
The Consumer Price Index (CPI) is a monthly price index published by the US Bureau of Labor Statistics (BLS). It tracks the average change over time in the prices urban consumers pay for a fixed set of goods and services. The index is not a dollar figure and not a bill for any household. It is a comparison tool.
Read the CPI as a thermometer, not a budget. A reading of 300 tells you prices are roughly three times what they were during the base period of 1982 to 1984, which is set equal to 100. It says nothing about how much your own groceries cost this week.
CPI versus inflation
The CPI is an index level; inflation is the rate of change in that level. When the CPI moves from 310.5 to 312.1 in one month, the index rose, and the inflation rate for that month is the percent change, roughly 0.5%. Index levels only mean something when you compare two of them.
Who produces it
The BLS, part of the US Department of Labor, publishes the CPI-U for urban consumers, covering about 93% of the US population. A second series, CPI-W, covers urban wage earners and clerical workers and is the basis for Social Security benefit adjustments. A separate nationwide CPI measures the cost of a fixed basket in every part of the country, not just metropolitan areas.
CPI versus the PCE price index
The Personal Consumption Expenditures (PCE) price index comes from the Bureau of Economic Analysis and is the Federal Reserve’s preferred gauge. It uses different weights, tracking health care and financial services much more heavily and housing much less heavily. Both measure inflation; they simply feel different because the baskets differ.
What Is in the CPI Basket?
The BLS does not pick items by opinion. Spending patterns come from the Consumer Expenditure Survey, which asks a sample of households what they actually bought over the past year, from gasoline and eggs to tuition and pet food. Those spending patterns determine which items enter the basket and how much weight each one carries.
The survey data points to eight major groups, and each group contains many specific item definitions the price collectors track month after month.
| Category | Examples of what it tracks | Why it matters for measurement |
|---|---|---|
| Food and beverages | Milk, eggs, bread, ground beef, coffee, restaurant meals, soft drinks | Split into food at home and food away from home, because they behave differently |
| Housing | Rent of primary residence, owners’ equivalent rent, gas and electricity, household furnishings | The single largest category, so it drives most headline movements |
| Apparel | Shirts, jeans, shoes, coats | Frequent style changes make quality adjustment a constant task |
| Transportation | New and used vehicles, gasoline, public transit, parts and maintenance | Splits into vehicle prices and fuel prices, which move in opposite directions at times |
| Medical care | Physician visits, prescriptions, dental services, hospital care | Collected from insurers and providers rather than only from store shelves |
| Recreation | Television sets, cable service, sports equipment, admission fees | Fast-changing product cycles and heavy discounting |
| Education and communication | Tuition, school supplies, telephone service, smartphones, internet service | Tuition is surveyed separately and updated on its own cycle |
| Other goods and services | Personal care, tobacco, alcohol, jewelry, household services | Tobacco and alcohol are weighted for their large share of spending despite covering fewer households |
Inside each category sit hundreds of item definitions, and some of them are narrow. Eggs, one grade and one package size, is tracked separately from a different size. That precision is what lets the BLS notice a price change that is really a size change.
A household that spends nothing on a category still feels nothing when that category spikes. Someone who rents pays a figure that rises with the shelter index, while an owner with a fixed-rate mortgage may see shelter costs barely move at all in cash terms. The basket is a national average of what households buy, not a description of yours.
How the Consumer Price Index Is Measured Step by Step
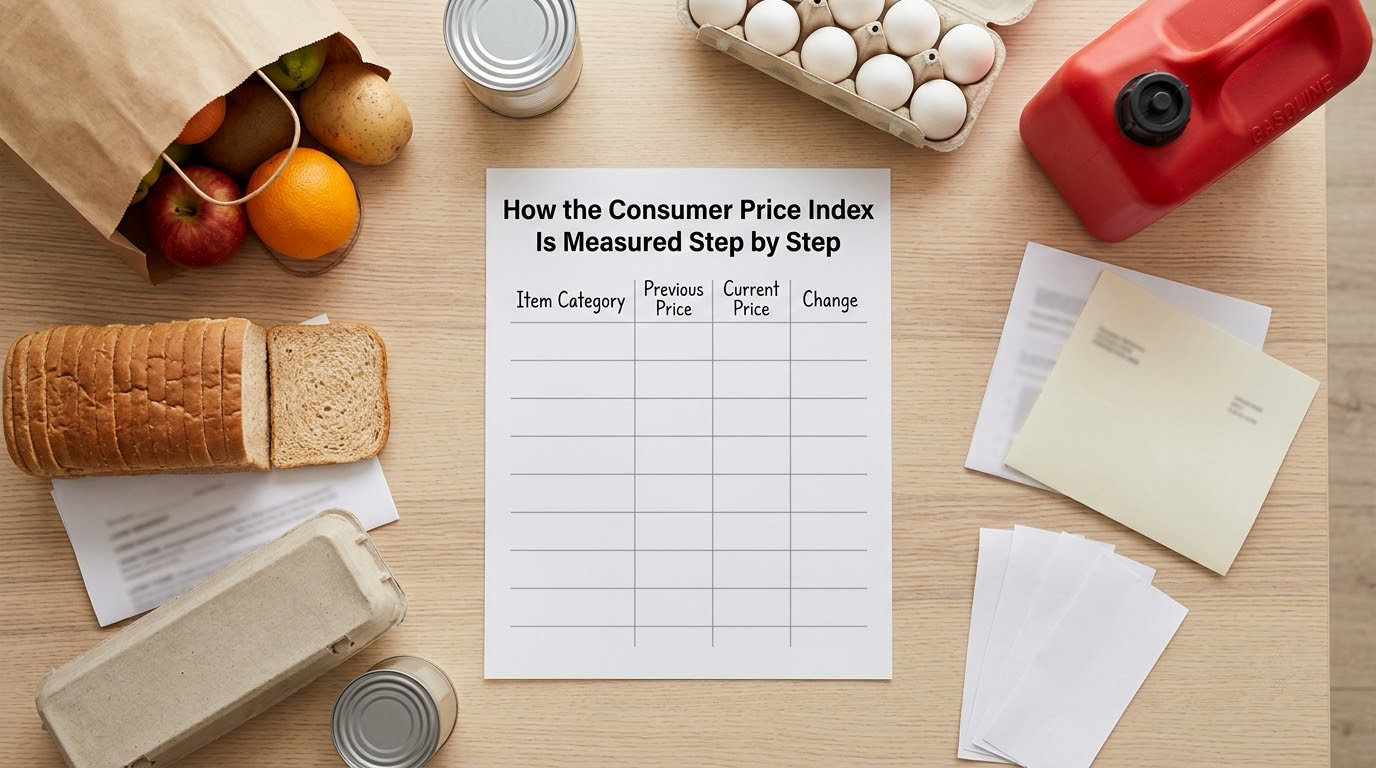
One monthly cycle moves through the same stages every time. Here is how the consumer price index is measured from raw observations to a published number.
- Survey household spending. The Consumer Expenditure Survey collects what urban consumers buy, setting the relative importance of every item and category.
- Choose the items. Analysts decide which specific goods and services go into the basket, and they add or retire items as spending habits change.
- Select outlets. A probability sample picks the stores, dealers, and service providers where prices will be recorded, and the sample is rotated every few years.
- Price the items. Field economists visit or call each outlet and record the actual transaction price, month after month for the same item.
- Adjust for quality. When a model changes, the price difference above a quality change is removed, so a better phone does not register as pure inflation.
- Aggregate into an index. Item price relatives are averaged, weighted by relative importance, and combined into category, then all-category, indices.
- Calculate the rate. The percent change between periods becomes the inflation rate, reported monthly and over the trailing twelve months.
- Publish. The BLS releases the results on a fixed schedule, with headline, core, and trimmed-mean measures plus detailed tables.
The arithmetic at the heart of it is short enough to write out:
CPI = (cost of the basket in the current period ÷ cost of the same basket in the base period) × 100
Here is a simplified illustration, using cost points so nothing depends on current prices. Suppose the basket cost 100.00 cost points in the base period and 118.40 cost points this month. Dividing 118.40 by 100.00 and multiplying by 100 gives an index of 118.4, meaning the basket is 18.4% more expensive than in 1982 to 1984. That calculation uses fixed basket quantities, which is what makes it a Laspeyres index.
| Step | What the BLS does | Output at that stage |
|---|---|---|
| 1. Spending survey | Records what households bought over a year | Expenditure shares per item and category |
| 2. Item selection | Chooses the goods and services to track | A defined market basket with quantities |
| 3. Outlet sampling | Picks stores and providers to visit | A rotated sample of pricing locations |
| 4. Price collection | Records actual quoted prices each month | Prices by item, outlet, and geography |
| 5. Quality adjustment | Strips out changes that reflect a different or better item | Comparable price relatives |
| 6. Aggregation | Averages relatives and applies expenditure weights | Item, category, and all-items index numbers |
| 7. Publication | Compares periods and reports percent change | Monthly, annual, core, and regional measures |
What Do the CPI Categories and Weights Mean?
Relative importance is each category’s share of total urban consumer spending. Because every item’s change is weighted by how much households actually spend on it, a big move in a heavy category pushes the headline number much harder than a big move in a light one.
Weights are not fixed forever. The BLS updates expenditure weights from the Consumer Expenditure Survey on a schedule tied to the two-year cycle of survey data, and it updates relative importance between updates as spending shares shift. That keeps the index from slowly drifting away from how people actually spend.
Take a deliberately simplified example rather than the current published weights. Assume a household spending pattern of 35% on housing, 15% on food, 12% on transportation, 8% on medical care, and 30% spread across everything else. If housing prices rise 5% and every other category rises 1%, the weighted change is 0.35 × 5% + 0.65 × 1%, which works out to 2.4%. Housing does the heavy lifting.
This is also why a 1% rise in the overall CPI never means every category rose 1%. Some categories can fall while the index still climbs, and the ones you care about personally can move sharply in the opposite direction.
How Does the Bureau of Labor Statistics Collect Prices?
Price collection is field work, not a database scrape. Economists visit establishments on a schedule, record the transaction price for a specified item, and note promotions and sales, since discounting is real price movement rather than noise to be removed.
Some items are priced from actual transactions. A supermarket shows what a shopper pays. Some come from administrative records instead, including gasoline and diesel prices taken from transaction databases across thousands of service stations nationwide, which buys enormous coverage in a category that moves quickly.
Rental housing and medical care are the hard cases. Rent is sampled from tenant-initiated questionnaires gathered through a panel, spread over years because turnover is slow. Owners are not charged rent, so the shelter index imputes an owners’ equivalent rent: an estimate of what it would cost to rent the home rather than own it, calculated using rental equivalence and mortgage rate assumptions.
Who is counted and who is not
The CPI-U covers urban consumers, which includes urban wage earners, clerical workers, retirees, and unemployed people living in urban areas. It excludes rural households, members of the armed forces, and people in prisons, mental institutions, and nursing homes. CPI-W narrows the group to urban wage earners and clerical workers, which is why benefit adjustments that follow CPI-W do not track the headline number exactly.
Omissions matter. Income taxes and Social Security contributions are not prices of goods or services, so they stay out. Investment prices, life insurance premiums paid by employers, and home purchases also stay out. That is defensible for measuring cost of living, and it is still a source of complaint from people who feel richer or poorer than the index says.
Why Can the CPI Differ from What One Household Experiences?
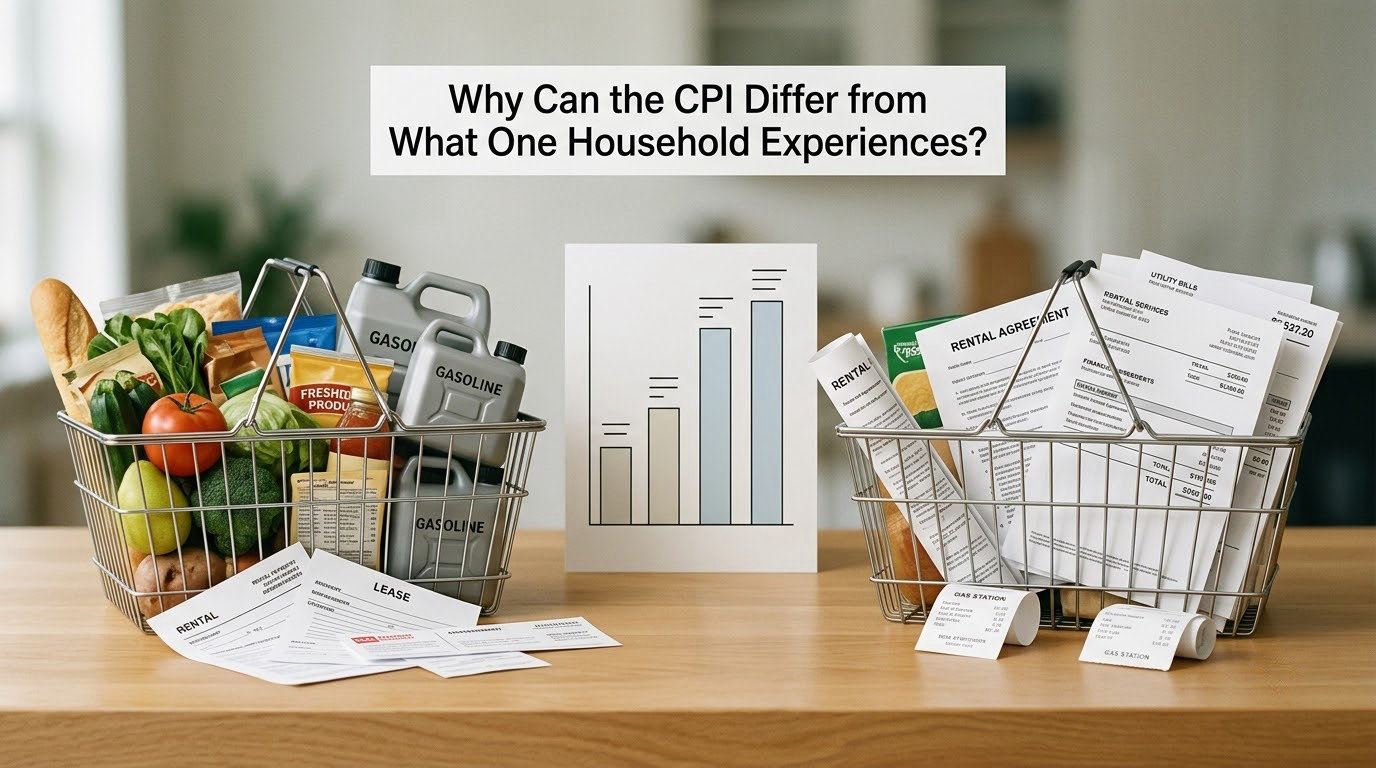
Start with weights. Housing is the heaviest category by far, so a household that rents, or that has a variable-rate mortgage resetting, experiences shelter inflation more directly than the headline suggests. A retiree spending on health care and prescriptions has a heavier medical weight than the national basket does, so their personal rate can run hotter or colder than the published one.
Next comes owner-equivalent rent. It is an estimate, not a payment, and it responds to rental markets and interest rate assumptions rather than to a homeowner’s actual bill. For a household with a fixed mortgage, that portion of the index describes a cost they never incur.
Region matters as well. The BLS publishes separate measures for metropolitan areas and regions, and a 3% national rise can accompany a very different number in a specific city. People also shop differently than the average: buying in bulk, switching brands, or timing purchases changes the price an individual actually pays.
Then come the known biases. Substitution bias comes from the fixed basket: if prices of one item rise sharply, a rational household switches to a cheaper option, but the CPI keeps measuring the original item. New goods bias shows up when a genuinely new product enters at a high price and later drops, which the index counts as inflation. Outlet substitution describes consumers moving from a specialized shop to a discount retailer that the sampling design does not fully capture.
One-time shocks hit one category hard, such as an energy move or a crop failure, and can leave the headline far above what a person who does not spend much in that category notices. Quality adjustment also involves judgment. When a model changes, deciding how much of the new price reflects a better product rather than the same product costing more is a judgment call that no single method removes.
Taken together, the guidance is simple: treat the CPI as a broad national signal about the direction and rough size of price change, then compare it with your own spending record. A spreadsheet with twelve months of your own recurring costs does more for your planning than the headline number does.
How Is the CPI Used in Personal Finance and Investing?
Because the CPI tracks prices, it converts a nominal figure into a real one. A pension of 3,000 a month means something different now than it did a decade ago, and the index is how you adjust for the difference without guessing.
It also sets automatic increases. Social Security benefits and many federal and military retiree pensions adjust by the CPI-W for a specified period each year. Union contracts, pensions with a cost-of-living adjustment, and some rent and tuition escalators are written with a CPI clause, so the index has direct money consequences.
Wage and inflation comparisons rely on it too. If your raise came in below the CPI change, your real income fell even though your pay went up. Real income is simply your income adjusted by the index, and that single calculation explains a lot of frustration during periods of elevated inflation.
Central banks watch it as input to policy, which is why markets move on a CPI release morning before the numbers are even parsed. For investors, the useful habit is to treat CPI as one signal among several. Movements in the index do not guarantee any investment return, and index levels say little on their own about where prices go next.
| Measure | Publisher | Notable weighting | Main use |
|---|---|---|---|
| Headline CPI | BLS | Heavy shelter weight, including owners’ equivalent rent | Cost-of-living adjustment, public awareness |
| Core CPI | BLS | Same basket minus food and energy | Underlying trend, policy signal |
| Trimmed-mean CPI | BLS with the Federal Reserve Bank of Cleveland | Drops the most extreme monthly price moves | Reducing distortion from one-off shocks |
| PCE price index | Bureau of Economic Analysis | Less housing, much more health care and financial services | Federal Reserve policy decisions |
Rules, weights, and index construction can change over time, and the specific numbers shift with every release. Read the BLS releases directly rather than relying on a headline summary, and check the release calendar so you know when a new print is due.
Frequently Asked Questions
How often is the CPI released, and where can I read the raw data?
The Bureau of Labor Statistics publishes the CPI every month, typically in the second week, and posts the release with detailed tables on its website. Those tables break the index down by category, region, and metropolitan area, and they carry both seasonally adjusted and unadjusted figures. The release calendar on the BLS site lists the exact publication date for every upcoming report.
Does the CPI measure the cost of living for one exact household?
No. The CPI describes average price change for urban consumers as a group, using one national basket of goods and services. Your own rate depends on where you live, whether you rent or own, and what your household actually buys. Someone who rents tracks shelter inflation more directly than the headline suggests, while a household with a fixed mortgage and heavy medical costs can move in the opposite direction.
What is the difference between the Consumer Price Index and inflation?
The CPI is an index level, a number that shows how far prices have moved since the 1982 to 1984 base period, which is set to 100. Inflation is the rate of change in that level over a period. A CPI reading of 320 does not mean prices rose 320 percent this year. It means the whole index is far above its base period, and the inflation rate is the percent change between two readings.
How are quality changes handled when a product changes?
When a product changes, the BLS compares the new price with what the old item would have cost today and removes the portion explained by the improvement. A better phone selling at a higher price therefore does not register as pure inflation. That adjustment is a judgment call, and different methods can produce different results, which is one reason analysts read several inflation measures together.
Why is the CPI often criticized as inaccurate?
The main complaints are structural rather than clerical. A fixed basket creates substitution bias, because households switch to cheaper items that the index no longer tracks. New products arriving at high prices create new goods bias, and sampling may miss a shift toward discount retailers. Indexes are also adjusted rather than canceled when mistakes surface, which some readers see as an accountability problem.
Does the CPI ever go negative?
Yes. Inflation measured as the change in the index can fall below zero during periods of falling or flat prices, and the BLS has reported negative monthly and annual rates more than once. Monthly readings also swing with seasonal patterns such as energy and apparel sales, which is one reason economists prefer to watch the twelve-month change and core measures before drawing conclusions.
What to Take Away About the CPI
The BLS builds a weighted basket from household spending surveys, prices about 80,000 items each month at a rotated sample of outlets, adjusts for quality changes, and divides the current basket cost by the base-period cost to get an index anchored at 100 for 1982 to 1984. The percent change between two readings is the inflation rate, and several related measures exist for different jobs.
Here is what to do first: use the CPI as a broad benchmark, then spend twenty minutes comparing it against your own last twelve months of recurring costs. Shelter, health care, and insurance will tell you quickly whether your household runs above or below the national average, and that is the number worth planning against.