
If you want the short version: headline inflation is the change in the price of everything Americans buy, food and energy included. Core inflation is the same Consumer Price Index with those two categories removed. Neither one is the “real” inflation rate, and the gap between them tells you more than either number alone.
That gap is also the source of a lot of arguments. One news outlet says inflation is running hot, another says the underlying picture is cooling, and your own grocery receipt says something different from both. All three can be describing the same month accurately.
Both figures come from the Consumer Price Index (CPI) published by the Bureau of Labor Statistics. Headline CPI, formally “all items,” is the full basket. Core CPI is the basket with two categories stripped out. The split exists because food and energy prices jump around for reasons that have nothing to do with whether price pressure is becoming permanent, and central bankers would rather not chase those swings. The Bureau of Labor Statistics publishes both, and so does the Federal Reserve, which uses core measures in its own forecasting and communication.
The rest of this guide breaks down what each measure contains, why they drift apart, and how to use the two numbers without talking yourself into a bad decision.
Table of Contents
- Core Inflation vs Headline Inflation at a Glance
- What Is Headline Inflation?
- What Is Core Inflation?
- Why Do Headline and Core Inflation Numbers Differ?
- Which Inflation Measure Should You Watch?
- How to Use Both Inflation Numbers in Real Life
- Core Inflation vs Headline Inflation: Which Signal to Use
- Why your personal inflation rate can run above headline CPI
- CPI vs PCE vs PPI: why outlets quote different numbers
- Which Should You Choose?
- Frequently Asked Questions
- Which is more important: core or headline inflation?
- Why can headline inflation be higher than core inflation?
- Does the core inflation rate exclude all volatile prices?
- Is core inflation always better for forecasting interest rates?
- How should inflation affect my emergency fund or investments?
- Does a fall in headline inflation mean prices are going down?
- Conclusion: Start With Both
Core Inflation vs Headline Inflation at a Glance
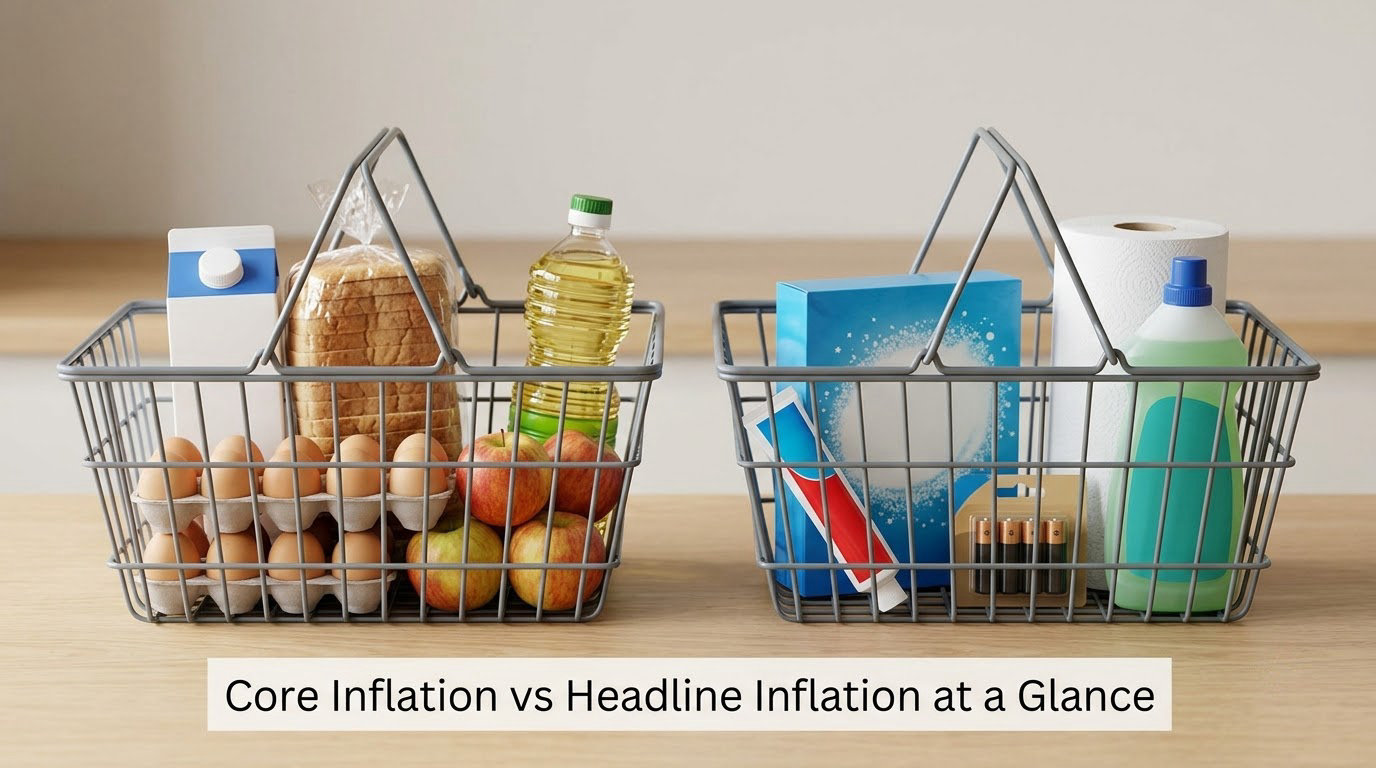
| What to compare | Headline inflation | Core inflation |
|---|---|---|
| What it measures | Change in prices across the entire consumer basket | Change in the same basket with food and energy removed |
| Bundled categories | Everything: shelter, food, gasoline, utilities, apparel, medical care, services | Shelter, apparel, medical care, household goods, transportation services, new and used vehicles |
| Common exclusions | None, beyond the index’s own scope | Food, energy, and categories such as tobacco in some variants |
| Volatility | High, month to month | Low, month to month |
| Reaction to supply shocks | Moves sharply and immediately | Largely ignores them |
| Main drivers | Gasoline, electricity, groceries, weather, harvests, fuel markets | Rent and owners’ equivalent rent, medical services, insurance, wages, services |
| Best for | Measuring current cost-of-living pressure on households | Judging the underlying trend that policy responds to |
| Typical users | Budgeters, benefit calculators, cost-of-living adjustments | Central banks, bond traders, economists, long-horizon investors |
| Reliability for trends | Poor over a quarter, decent over a year | Better over a quarter, still distorted by shelter lags |
| Biggest weakness | Energy shocks can swamp everything else for months | Excludes the two categories many households spend the most on |
One caveat before the details: both are signals, not a description of any particular household’s costs. The average consumer that the index represents is a statistical construction, and your household almost certainly does not match it.
What Is Headline Inflation?
Headline inflation is the change in the average price of the whole consumer basket, and it is what almost every news report means when it says “inflation.” The Bureau of Labor Statistics calls it CPI-U, all items.
The basket covers a wide spread of spending: shelter, which includes rent and owners’ equivalent rent, is the single largest weight. Food and energy together account for a meaningful share. Then come medical care, transportation, apparel, household furnishings, recreation, education and communication.
Because headline includes everything, it is the honest answer to the question “how much more am I paying than a year ago?” That is also why it swings. Gasoline can fall sharply in one month and climb back the next, and those moves pass straight through to the headline number.
Energy is the usual culprit, and it does not take much. If gasoline drops 15% while every other category is flat, headline inflation goes negative for a month even though nothing about the underlying trend changed. Add a weather event that raises grocery prices, or a utility rate adjustment in one region, and you get another swing in the opposite direction.
None of this makes headline inflation wrong. It makes it a poor instrument for reading a trend over a few months, and an excellent instrument for describing what a family is paying this quarter.
What Is Core Inflation?
Core inflation is the change in the same Consumer Price Index with food and energy removed. That is the entire definition, and the simplicity of it hides a real conceptual problem.
Core is not a second complete inflation rate. It is a filtered version of one. When economists say core inflation is 3%, they do not mean your overall cost of living rose 3%. They mean the part of the basket outside food and energy rose 3%.
What ends up inside core inflation is worth listing, because most readers have never seen the list:
- Shelter: rent of primary residence, tenants’ insurance, and owners’ equivalent rent, the rent a homeowner would pay to rent their own house
- Medical care services: physician visits, hospital stays, dental work
- Transportation services: car insurance, airline fares, registration fees
- Apparel and household furnishings
- New and used vehicles
- Recreation, education and communication services
Shelter alone usually makes up roughly a third of the core basket, which is why rent statistics dominate so many inflation debates. And shelter has a measurement lag: the Bureau of Labor Statistics samples rents, not rents that are about to be signed. If new leases are cooling, reported shelter inflation can stay elevated for a while before the data catches up. That lag is the single most common reason people conclude the official numbers are dishonest.
Two related measures get grouped with core inflation in most reporting. Trimmed mean CPI removes the most volatile price changes in a month regardless of category. The “supercore” label, more common in market commentary than in official releases, refers to services excluding shelter. They are different constructs, and if you see a supercore number, check which definition the source used.
Why Do Headline and Core Inflation Numbers Differ?
The two numbers diverge because they are the same basket with two volatile categories removed, and those two categories do not move with everything else.
Here is a worked example. Suppose headline inflation prints at 2.7% while core prints at 3.1% in the same month. That combination says energy and food prices fell slightly year over year while everything else kept climbing. If those food and energy declines fade, headline drifts back toward core without any new pressure appearing in the economy.
Reverse the signs and the story changes. Headline at 3.4% with core at 2.9% means energy and food are doing the pushing, and the broader basket is cooling underneath. Central banks generally read that second print as better news than the first, because demand-driven price pressure is easier to control than a supply shock.
There is a second reason the numbers differ, and it is more technical. Core inflation is not computed by removing food and energy from a single month and calling it a day. It is a weighted index of everything else, which means a category with a small weight can move a lot without moving core much, and a large category can barely budge. Shelter’s weight alone is enough to swamp most of the others.
Comparing month-over-month with year-over-year readings adds another layer. The monthly figure is noisy but current. The annual figure smooths the noise but carries base effects: if prices spiked twelve months ago, the same price today shows up as a lower year-over-year rate even though nothing improved this month. A flattering annual print can hide a bad recent month, and the reverse is true too.
The honest summary is that neither measure can tell you whether prices are going up or down in absolute terms. Both tell you the rate of change. A falling core rate means prices are rising more slowly, not that they are falling.
Which Inflation Measure Should You Watch?
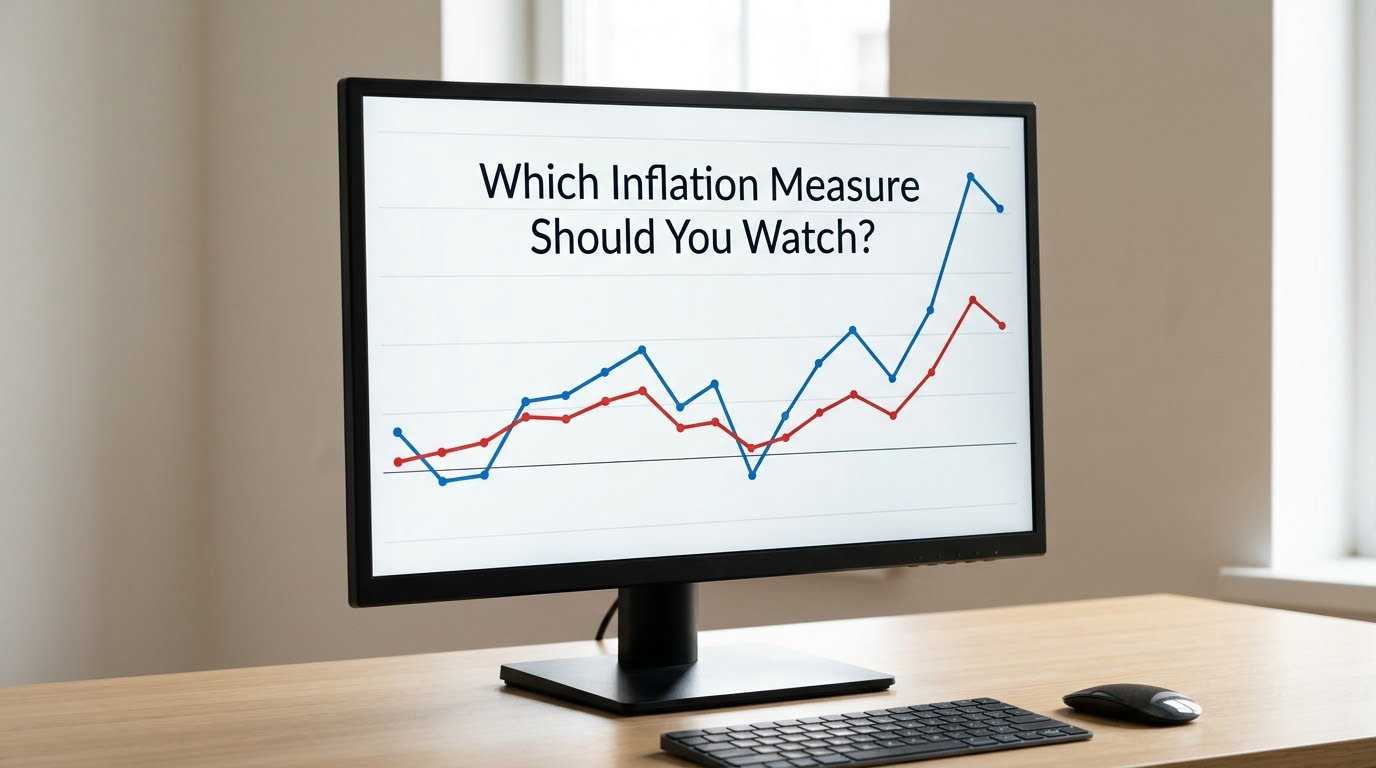
Watch headline inflation when you care about what you pay this year. Watch core inflation when you care about whether price pressure is settling into wages, rents and services. Watch both when you are making any decision that spans more than a few months.
Headline is the honest measure of current cost-of-living pressure, because it includes the categories that dominate a typical household’s discretionary and essential spending. If you are setting a grocery budget, comparing rent renewals, or checking how much a benefit adjustment will actually buy, headline is the relevant number. This is also the measure used to index many contracts, including Social Security benefits and some rent and wage agreements.
Core is the better guide to persistence. A central bank sets policy that transmits over quarters and years, and interest rates cannot make an oil price fall. Watching core removes the temptation to raise rates because of a supply shock that will have reversed on its own. For anyone building a view on interest rate expectations or bond yields, core is where most of the signal sits.
Markets complicate this further, and the pattern is worth knowing if you follow financial coverage. A soft core number tends to move markets more than a soft headline number, because core feeds directly into the rate path. A headline surprise driven by gasoline often fades. As one market commentator put it in similar terms, markets trade the persistence of inflation rather than the print itself.
Watch the direction of both series over six to twelve months. The level of either one in a single month is close to noise.
How to Use Both Inflation Numbers in Real Life
Core Inflation vs Headline Inflation: Which Signal to Use
Use core to judge underlying pressure and headline to judge your cost of living. Those are the two jobs, and they rarely conflict when you keep them separate.
For a saver or a bond investor, core matters more because it tracks the pressure that policy responds to. If core drifts down for several months, the market has reason to expect easier policy and eventually lower yields, which is generally good for existing long-term bonds.
For a household, headline matters more because it is closer to the actual bill. A family of four buying groceries and driving a lot will feel food and energy moves that a renter paying a fixed lease will barely notice.
For a borrower, neither number tells you what your rate will be, but a persistent core decline makes a lower rate more plausible over the next year than a headline decline does. Variable-rate debt is tied to policy expectations, not to grocery prices.
Why your personal inflation rate can run above headline CPI
This is the most common complaint people have about the data, and it is usually not a conspiracy. It is a weighting problem with a few genuine measurement gaps.
Basket weighting is the biggest factor. The index assumes a national average share of spending across households. Spend yours differently and your experience will differ. A household that spends a larger share on health care sees medical prices, which sit inside core and have their own slow upward drift. A household that spends heavily on groceries sees food, which core deliberately ignores.
Regional prices matter too. Housing costs, insurance rates and utility rates vary enormously by state and metro area, and the index weights them by population rather than by your local market. A move in one regional shelter index can move the national number while your own rent does nothing.
Substitution is a quieter factor. When the price of one thing rises, people buy something else, and the index adjusts the basket over time. Your own substitution happens faster than the official one.
Then there are things no index captures well. Smaller package sizes with unchanged shelf prices, called shrinkflation, change the unit price without changing the price on the receipt line. A 12-ounce can that becomes a 10.4-ounce can at the same price registers almost nowhere in the data.
Finally, spending weights are published with a lag and revised. What the Bureau of Labor Statistics currently calls the typical basket is not the basket it used two years ago.
If you want a personal number, the honest way to get one is to track your own spending over a rolling twelve months and divide by the same period a year earlier. The Bureau of Labor Statistics does not offer that, and no other statistic will do it for you.
CPI vs PCE vs PPI: why outlets quote different numbers
When two news outlets disagree about inflation, check which index each is using. There are three that get quoted constantly.
The CPI is the Bureau of Labor Statistics measure of consumer prices. It is the most widely recognized, and both headline and core versions come from it.
The PCE price index, the Personal Consumption Expenditures index, comes from the Bureau of Economic Analysis and is the Federal Reserve’s preferred measure. It is built differently: it uses more comprehensive coverage, including spending by people who do not file tax returns and by nonprofit institutions, and it applies a different formula that tends to produce somewhat lower readings. “Core PCE” strips food and energy out of that index, and the Federal Reserve’s 2% inflation target refers to PCE, not CPI. A 2% PCE target is therefore not the same as a 2% CPI target.
The PPI, Producer Price Index, measures prices at the factory and wholesale level. It feeds into the CPI rather than describing consumer costs, and it is useful for reading margin pressure and pipeline costs. It is not a measure of your cost of living.
All three also have trimmed variants, and each is published both month-over-month and year-over-year. When you see a number without a source, that ambiguity is usually the reason two headlines look contradictory.
Outside the United States the naming shifts too. The UK publishes a headline CPI, a CPI excluding owner occupiers’ housing costs, and a separate core CPI that removes food, energy, alcohol and tobacco. The Eurozone uses HICP, the Harmonised Index of Consumer Prices, with its own core version. Definitions that look identical across countries are rarely identical in practice.
Which Should You Choose?
Match the measure to the goal, and stop trying to pick a single winner.
Choose headline inflation when you want a current snapshot of cost-of-living pressure: budgeting, rent comparisons, benefit estimates, salary negotiation context, or a general sense of what things cost this year.
Choose core inflation when you want an economic trend: interest rate expectations, bond positioning, judging whether the Federal Reserve is likely to move, or assessing whether price pressure is embedded in wages and services.
Choose both when the decision is bigger than either view. A mortgage decision, a job move, or a long-horizon allocation of savings should not rest on a single monthly reading. Look at the twelve-month trend in both, note which one is leading, and remember that neither predicts your personal bill with any precision.
One practical habit settles most of the confusion. When a headline startles you, check three things before reacting: which index it came from, whether it is a monthly or annual figure, and whether core is moving in the same direction. If core agrees, the move likely reflects a real change in pressure. If core disagrees, it is usually a supply story that will wash out.
Frequently Asked Questions
Which is more important: core or headline inflation?
Headline inflation is more important for your household costs, because it includes food and energy. Core inflation is more important for interest rates and economic trend analysis, because it strips out the volatile supply-driven categories that monetary policy cannot control. A reader building a budget should follow headline; a reader thinking about rates, bonds or economic direction should follow core.
Why can headline inflation be higher than core inflation?
When gasoline, electricity or grocery prices climb faster than everything else, headline rises while core sits still or falls. That is a supply-side story rather than a sign that price pressure is spreading through wages and services. Central banks usually read a headline number above core as temporary, which is why markets often shrug off a hot headline print when core is calm.
Does the core inflation rate exclude all volatile prices?
No. Core inflation removes only two categories, food and energy. It still contains volatile items like used cars, airline fares and hotel stays. That is why some analysts also look at trimmed mean CPI, which strips the most extreme price changes in a month regardless of category, or at services excluding shelter, sometimes called the supercore measure.
Is core inflation always better for forecasting interest rates?
Not always. Core is a better signal than headline because it removes supply shocks that policy cannot influence, and Federal Reserve officials give it more weight. But core also carries a long lag through shelter, which is measured from sampled rents rather than new leases. A rising core print driven by shelter can therefore describe a trend that has already begun to cool.
How should inflation affect my emergency fund or investments?
Keep enough in cash to cover several months of expenses, because a falling inflation rate does not mean falling prices. For investments, a persistent decline in core inflation makes lower interest rates more plausible, which can help existing bonds. Avoid reacting to a single headline or core print, and remember that rules, rates and tax treatment vary by country and by state.
Does a fall in headline inflation mean prices are going down?
No. A falling inflation rate means prices are rising more slowly than before, not that they are falling. If inflation runs at 2% for a year, the overall price level still rises by about 2% across that year. Prices return to earlier levels only after a sustained period of actual deflation, which is rare and usually temporary.
Conclusion: Start With Both
Core inflation and headline inflation answer different questions, and the disagreement between them is information rather than a defect. Headline describes the change in prices across the whole basket, which is what a household actually pays. Core removes food and energy to reveal whether that pressure is becoming persistent, which is what the Federal Reserve responds to.
Start by checking both on the Bureau of Labor Statistics release, then look at the direction over six to twelve months rather than the level in a single month. If core is turning down steadily while headline stays high, the cost of living is still rising but the pressure behind it is easing. That combination is the one to watch most closely in 2026, and it is the one your next financial decision probably depends on.