The main dow vs sp 500 vs nasdaq differences come down to how many companies each index holds and how it weighs them. The Dow Jones Industrial Average is a price-weighted average of 30 blue-chip stocks, the S&P 500 is a float-adjusted market-cap index of 500 large U.S. companies, and the Nasdaq Composite covers roughly 3,000 securities listed on the Nasdaq exchange.
A stock market index is just a basket of companies tracked as one number, so a headline reading “the Dow closed up 600 points” is a report about that basket, not about any individual share or about what your account did that day. The three baskets were built for different jobs, which is why they can move in different directions on the same afternoon.
For most people building long-term U.S. exposure, the S&P 500 does the most useful work of the three. Here is what each one actually owns, how the return is calculated, and where the differences show up in a real account.
This is general information, not personal investment advice. Index returns are history, not a forecast, and nothing here predicts future results.
Table of Contents
- Dow vs S&P 500 vs Nasdaq Differences at a Glance
- What Is the Dow Jones Industrial Average?
- What Is the S&P 500?
- What Is the Nasdaq Composite?
- How Do the Three Indexes Calculate Returns?
- A worked example with two invented companies
- How Do Holdings and Market Coverage Differ?
- What Do Sector Exposure and Concentration Mean for Investors?
- Which Index Has More Diversification?
- How Do Volatility and Historical Performance Differ?
- Which Should You Choose?
- Dow vs S&P 500 vs Nasdaq: what each index is best for
- Costs, fund types and where to hold them
- Frequently Asked Questions
- Is the Nasdaq-100 the same as the Nasdaq Composite?
- Which is better, the Dow or the S and P 500?
- Which stock market index is the best indicator?
- Is Apple in the Dow Jones or the Nasdaq?
- Is it better to invest in the Nasdaq or the Dow Jones?
- Are the S and P 500 and a total-market fund the same thing?
- Conclusion
Dow vs S&P 500 vs Nasdaq Differences at a Glance
| Criterion | Dow Jones Industrial Average | S&P 500 | Nasdaq Composite |
|---|---|---|---|
| What it tracks | 30 established U.S. blue-chip companies | 500 leading U.S. companies | Every common-type share listed on the Nasdaq exchange |
| Number of constituents | 30 | 500 | About 3,000 |
| Launched | 1896 | 1957 | 1971 |
| Weighting method | Price-weighted | Float-adjusted market cap | Market cap |
| Who picks members | A committee applying judgment | A committee using published eligibility rules | Automatic: every eligible Nasdaq listing |
| Typical sector mix | Financials, industrials, consumer and health names | Broad, with information technology the largest sector | Highest technology and growth exposure, no financials |
| Typical volatility | Lowest of the three | Middle | Highest |
| Best used as a proxy for | Large established U.S. companies | The U.S. stock market as a whole | Nasdaq-listed growth and technology shares |
| Widely held fund | DIA | VOO, IVV, SPY | QQQ tracks the Nasdaq-100, not the Composite |
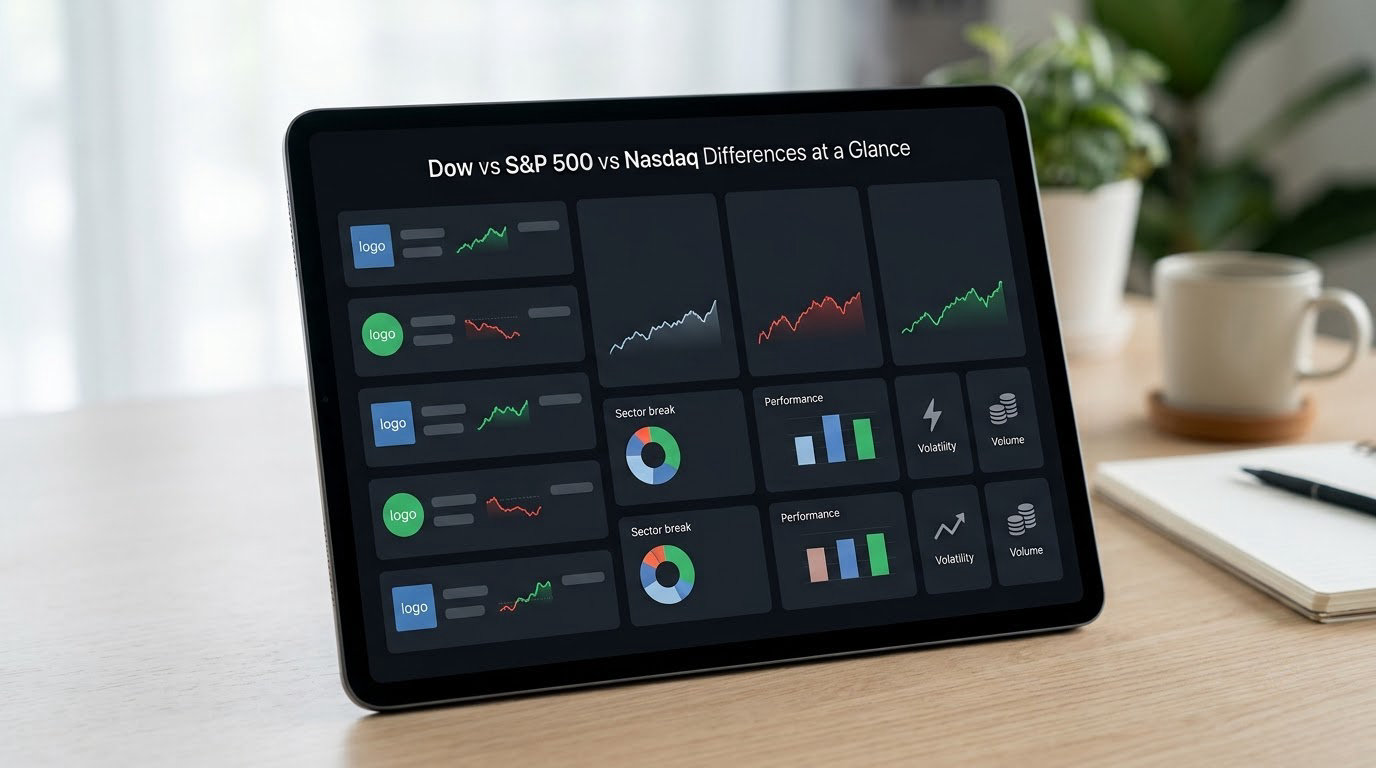
That table is the whole comparison in one view. The Dow is narrow and price-weighted, the S&P 500 is broad and cap-weighted, and the Nasdaq is broad by listing venue rather than by company size. Everything below is the detail behind those nine rows.
What Is the Dow Jones Industrial Average?
The Dow is a price-weighted average of 30 established U.S. blue chips, launched on May 26, 1896 by Charles Dow, co-founder of the Dow Jones & Company wire service. It began with 12 members and has been added to and pruned ever since.
Price weighting is the part beginners miss. The index adds up the 30 share prices and divides by a number called the divisor, so a 300-dollar stock moving 5 dollars pushes the index five times harder than a 30-dollar stock moving 1 dollar, no matter how large the company is. That is the reverse of how a cap-weighted index works, and it is why a modest move in a high-priced constituent can lead the evening news.
When a member splits its shares, the divisor is adjusted so the index level does not jump for no reason. Substitutions work the same way: the divisor resets when one company leaves and another enters, which keeps the history comparable. It is invisible housekeeping that almost nobody notices until they try to reconstruct the math.
Membership is decided by a committee rather than a formula, which is why the roster reads like a list of household names instead of a ranking. In 2024 the committee added Amazon and Nvidia and removed IBM and Intel, one of the more discussed membership changes in recent memory. Every addition is an argument about what blue chip means in the current economy.
What Is the S&P 500?
The S&P 500 tracks 500 leading U.S. companies and has become the default benchmark for the American stock market. It launched in 1957 as a successor to earlier Standard & Poor’s index work and is calculated by S&P Dow Jones Indices, the same company that maintains the Dow.
Its weighting is float-adjusted market cap: each company’s weight is its share of the index’s total market value, adjusted for shares held by insiders. The biggest companies move it most, and that structure is the main reason the S&P 500 and the Nasdaq tend to rise and fall together more than the Dow does.
Selection follows four published rules:
- U.S. domicile, so the company must file and trade as a U.S. company.
- A minimum market capitalization threshold, set in the billions of dollars and raised periodically by the committee.
- Four consecutive quarters of positive earnings.
- Liquidity and a substantial public float, generally at least half the shares, with exceptions for closely held companies.
An industry concentration rule also limits how much of the index a single sector can represent, though that limit has been loosened over the years as technology’s share grew.
Together, the size and coverage rules mean the S&P 500 spans roughly four-fifths of the total U.S. stock market. That is why so many retirement accounts default to an S&P 500 fund, and why an S&P 500 holding and a total-market holding often behave almost identically once you own enough of them.
What Is the Nasdaq Composite?
The Nasdaq Composite is a market-cap-weighted index of every common-type share listed on the Nasdaq exchange, published by Nasdaq Inc. It launched in 1971 with a base value of 100 and now covers roughly 3,000 securities, which makes it far broader than its nickname suggests.
It also holds no financial companies, since those mostly list on the New York Stock Exchange. Technology and growth companies dominate its weight anyway, which is where the reputation comes from, but the Composite is not a pure technology index and it includes plenty of small and mid-sized companies.
The distinction that catches people out is between the Composite and the Nasdaq-100. The Nasdaq-100 holds the 100 largest non-financial companies listed on Nasdaq, weighted by market cap with an individual cap, and it is rebalanced on a quarterly schedule. QQQ tracks the Nasdaq-100, not the Composite, which is why a QQQ holder’s return can look nothing like the Nasdaq number in the news.
How Do the Three Indexes Calculate Returns?

There are only two methods in play here. The Dow is price-weighted; the S&P 500 and the Nasdaq indexes are market-cap weighted. That choice decides how much a single company’s move matters to the headline number.
A worked example with two invented companies
Say Company A trades at 300 dollars a share and has 1 billion shares, so it is worth 300 billion dollars. Company B trades at 20 dollars a share and also has 1 billion shares, so it is worth 20 billion.
In a market-cap-weighted index, A carries about 94 percent of the weight. If A falls 5 percent while B rises 5 percent, the basket is close to flat, because the big company moved as much as the small one in percentage terms.
In a price-weighted basket, the arithmetic runs on prices alone: 300 times minus 5 percent, plus 20 times plus 5 percent, gives a net decline of 14 points on a 320-point base, roughly 4.4 percent. The index falls even though the two companies’ combined market value barely budged. The Dow method ignores how large a company actually is.
Two adjustments matter as much. The index numbers quoted in headlines are price returns, which leave dividends out, while a total-return version reinvests distributions and index funds generally track the total-return series, so a fund can beat the news number over time. And the S&P’s float adjustment, plus the Dow’s divisor reset after every split or substitution, keep the arithmetic honest when the underlying shares change.
How Do Holdings and Market Coverage Differ?
Thirty, 500, about 3,000. The count is the headline, but the overlap is the part that changes what you actually own. Most large Nasdaq-listed companies are also S&P 500 constituents, and the S&P 500 reaches across both exchanges. Buying the S&P 500 and the Nasdaq Composite together gives you something closer to a total-market portfolio than buying the S&P 500 and the Dow does.
One confusion is worth clearing up before anything else: Nasdaq and the New York Stock Exchange are exchanges, not indexes. The Nasdaq name belongs to both an exchange and a family of indexes, while the Dow and the S&P 500 are indexes built mainly from companies listing on the NYSE. That is also why the NYSE Composite, which does exist, is almost never quoted: it is not the measure of U.S. market capitalization the way the S&P 500 is, and news coverage has settled on one benchmark for big-picture market stories.
Membership churns at different speeds too. The Composite adds companies automatically, since any eligible listing joins the day it trades. The S&P runs a committee on a set schedule and swaps in newly eligible companies, removing acquired or demerged ones. The Dow needs no rulebook at all, because a committee applies judgment directly to a list of 30 names.
What Do Sector Exposure and Concentration Mean for Investors?
Sector mix is where the three indexes feel most different in a portfolio. The Dow’s 30 names lean toward financials, industrials, consumer and health companies, and its price weighting gives a mid-priced company more pull than a far larger one. The S&P 500 is broad but not neutral, with information technology the largest sector by a wide margin and a small number of mega-cap companies carrying much of the index. Nasdaq-oriented benchmarks push that concentration further.
The published index comparison pulled for this guide gives a usable snapshot: information technology made up about 45 percent of the S&P 500 against about 67 percent of the Nasdaq-100, and the ten largest holdings accounted for roughly 38 percent and 46 percent respectively. Treat those as one moment in time rather than a fixed rule, but the shape holds. Nasdaq-heavy exposure means more of your money in fewer companies.
Concentration is a risk rather than a mistake. When a handful of mega-cap technology names set the direction, the indexes holding the most of them move further in both directions, which cuts both ways across a full cycle.
Which Index Has More Diversification?
By raw count the Composite looks broadest, but count alone does not make a diversified portfolio. What matters is the weight of the ten largest positions, the spread of sectors, and whether your own holdings sit in the same names as the index’s. Thirty well-spread Dow members and 100 Nasdaq-100 members with a heavy top are two different kinds of concentration, and neither one is automatically the safer choice.
Overlap is what beginners miss. If you hold the S&P 500 and add a Nasdaq Composite fund, most of the second holding is already inside the first, and the new money does less work than the account summary suggests. Add a Nasdaq-100 fund instead and you are adding genuine technology weight, along with real single-name risk. Neither move is wrong. One is a quiet nudge toward total market, the other is a deliberate tilt.
One more check: pull up the holdings list on the funds you already own before assuming you own the market. Retirement plans default to an S&P 500 fund often enough that plenty of people hold broad U.S. exposure without having chosen it.
How Do Volatility and Historical Performance Differ?
Concentration drives volatility, and the same published comparison shows it plainly: one-year volatility ran about 12.4 percent for the S&P 500 against 19.0 percent for the Nasdaq-100, and five-year volatility about 17.5 percent against 23.2 percent. The Nasdaq-heavy series moved more in both directions over both windows.
The gap widens and narrows with the economy. The 2000 to 2002 technology unwind hit the Nasdaq far harder than the Dow, because the Dow’s roster was full of industrials and financials rather than internet names. In 2022, a year of rate-driven declines, the broad index lost a double-digit percentage while the growth-heavy index fell further. In long stretches between those years the technology-heavy index outran everything, and Nasdaq’s own published comparison shows the Nasdaq-100 up 315 percent against 156 percent for the S&P 500 between December 31, 2007 and June 28, 2019.
If you have wondered why the Dow seems to lag, the roster is the answer. The most common version of that question on investing forums gets the same reply every time: 30 stocks without a large technology presence cannot keep pace when mega-cap technology drives the market. The long-running consensus on Bogleheads is that the differences between broad U.S. indexes are small enough over decades not to be worth stressing over, as long as costs are low and you stay invested.
None of those figures is a promise. An index return is a record, not a forecast, and the years that favor one index are rarely the years that favor another.
Which Should You Choose?
Dow vs S&P 500 vs Nasdaq: what each index is best for
- Dow (DIA): a quick read on established U.S. blue chips. Fine as a talking point, thin as a core holding, since 30 names is a lot of concentration for a retirement account.
- S&P 500 (VOO, IVV, SPY): the default answer for a U.S. core holding, with broad sector representation and large-cap companies, and the benchmark most professional managers are measured against.
- Nasdaq Composite or Nasdaq-100 (QQQ): a growth satellite rather than a core. The Composite is broad but limited to one exchange, and the Nasdaq-100 is the concentrated technology version that belongs in a smaller allocation.
- Total market or small cap (VTI, IWM): worth knowing alongside these three. VTI adds the mid and small companies the S&P 500 leaves out, and IWM is the small-cap exposure some people pair with a large-cap core.
Costs, fund types and where to hold them
Expense ratios are small, and small still compounds. The common vehicles ran roughly 0.16 percent for DIA, 0.03 percent for VOO and IVV, 0.09 percent for SPY and 0.20 percent for QQQ as of early 2026, though providers cut fees and change trackers regularly, so check the current prospectus rather than trusting a number written down somewhere. I always look at the fund’s own page before buying for this reason.
Between an index mutual fund and an ETF, the difference is mostly trading style. A mutual fund buys at the day’s closing price, which suits a retirement account with automatic contributions, while an ETF trades intraday like a share and suits a brokerage account where you place orders yourself.
In a 401(k) or IRA, the S&P 500 fund is usually the default and the Dow fund is often offered as the conservative-looking alternative. Holding the diversified index in the tax-advantaged account is the simpler setup, and international exposure is worth adding through a fund that is not another hundred of the same U.S. names. Tax treatment and plan rules vary by account and by state, so check your own provider’s details.
Frequently Asked Questions
Is the Nasdaq-100 the same as the Nasdaq Composite?
No. The Nasdaq Composite includes roughly 3,000 securities listed on the Nasdaq exchange, including small companies and exchange-traded funds, while the Nasdaq-100 holds the 100 largest non-financial companies listed there and rebalances quarterly with an individual weight cap. QQQ, the fund most people hold, tracks the Nasdaq-100, not the Composite, so its returns often differ from the Nasdaq number in the news.
Which is better, the Dow or the S and P 500?
For investing, the S and P 500. It holds 500 companies instead of 30 and weights by market capitalization rather than share price, so it spreads money across the market more evenly. The Dow is still useful for reading headlines about established blue-chip companies, but its narrow roster and price weighting make it a thinner long-term holding than the S and P 500.
Which stock market index is the best indicator?
The S and P 500 is the most representative single number for the U.S. market, since it covers roughly four-fifths of total U.S. market capitalization across many sectors. The Dow gets quoted often because it is the most recognizable, not because it measures the market best. No index reliably predicts recessions, so treat any of them as a summary of prices rather than an economic forecast.
Is Apple in the Dow Jones or the Nasdaq?
Apple trades on the Nasdaq exchange, is one of the largest S and P 500 constituents, and is not a Dow component. The Dow’s members mostly list on the New York Stock Exchange, and membership is set by a committee rather than by exchange listing, which is why some huge Nasdaq-listed companies sit in the S and P 500 but never enter the Dow.
Is it better to invest in the Nasdaq or the Dow Jones?
The Nasdaq carries more growth and technology exposure and has historically been more volatile, with heavier swings in both directions. The Dow is steadier and more concentrated in 30 established companies. Most people use the broad S and P 500 as the core holding and treat a Nasdaq fund as a smaller satellite, rather than choosing between the two extremes.
Are the S and P 500 and a total-market fund the same thing?
Not identical, but closer than most people expect. A total-market fund holds every U.S. company across large, mid and small caps, while the S and P 500 covers only the 500 largest, which is roughly four-fifths of U.S. market capitalization. Over long periods the two funds track closely, and the gap is mostly the smaller companies the S and P 500 leaves out.
Conclusion
No index is universally best, and the differences that look dramatic in a headline often shrink once you look at what each one owns. Use the Dow to read the day’s blue-chip news, the S&P 500 as a broad low-cost core holding, and a Nasdaq fund only as a deliberate growth tilt you can size for the extra volatility.
If you want one next step, open the fund list in your retirement account and check how much U.S. market exposure you already hold. Adding a second broad index often duplicates what you have, and finding that out takes ten minutes.