
Stock market corrections vs bear markets come down to a single number. A correction is a decline of 10% to 20% from a recent peak in a major index such as the S&P 500, while a bear market is a decline of 20% or more. Drops under 10% are usually called pullbacks. That is the whole mechanical difference — but the cause behind each one is what actually changes how long it lasts and how deep it goes.
Most investors learn the two words on the same news broadcast and never sort out the difference afterward. Then, eighteen months later, one of them is holding a portfolio that fell 11% and one is holding a portfolio that fell 47%, and both think they had “a bad stretch in the market.” This guide is for anyone who wants to tell the two apart on their own terms, without a broadcaster telling them which one they are in.
This is educational information about market history and definitions, not investment advice. Rules, thresholds and market conditions change, and nothing here predicts what markets do next.
Table of Contents
- Stock Market Corrections vs Bear Markets at a Glance
- What Are Stock Market Corrections and Bear Markets?
- What Counts as a Correction or a Bear Market?
- How Do Corrections and Bear Markets Differ?
- What Actually Separates the Two Beyond the Number?
- What Causes Corrections and Bear Markets?
- How Should Investors Respond to Each?
- Can a Correction Turn Into a Bear Market?
- How Do Investors Know When a Bear Market Has Ended?
- Which Should You Choose?
- Frequently Asked Questions
- Is a 10% stock market decline always a correction?
- Can the stock market recover from a bear market quickly?
- Should investors sell during a correction or a bear market?
- Does a bear market always mean a recession?
- Can an individual stock enter a bear market while the broader market does not?
- Conclusion: Start With the Decline, Not the Label
Stock Market Corrections vs Bear Markets at a Glance
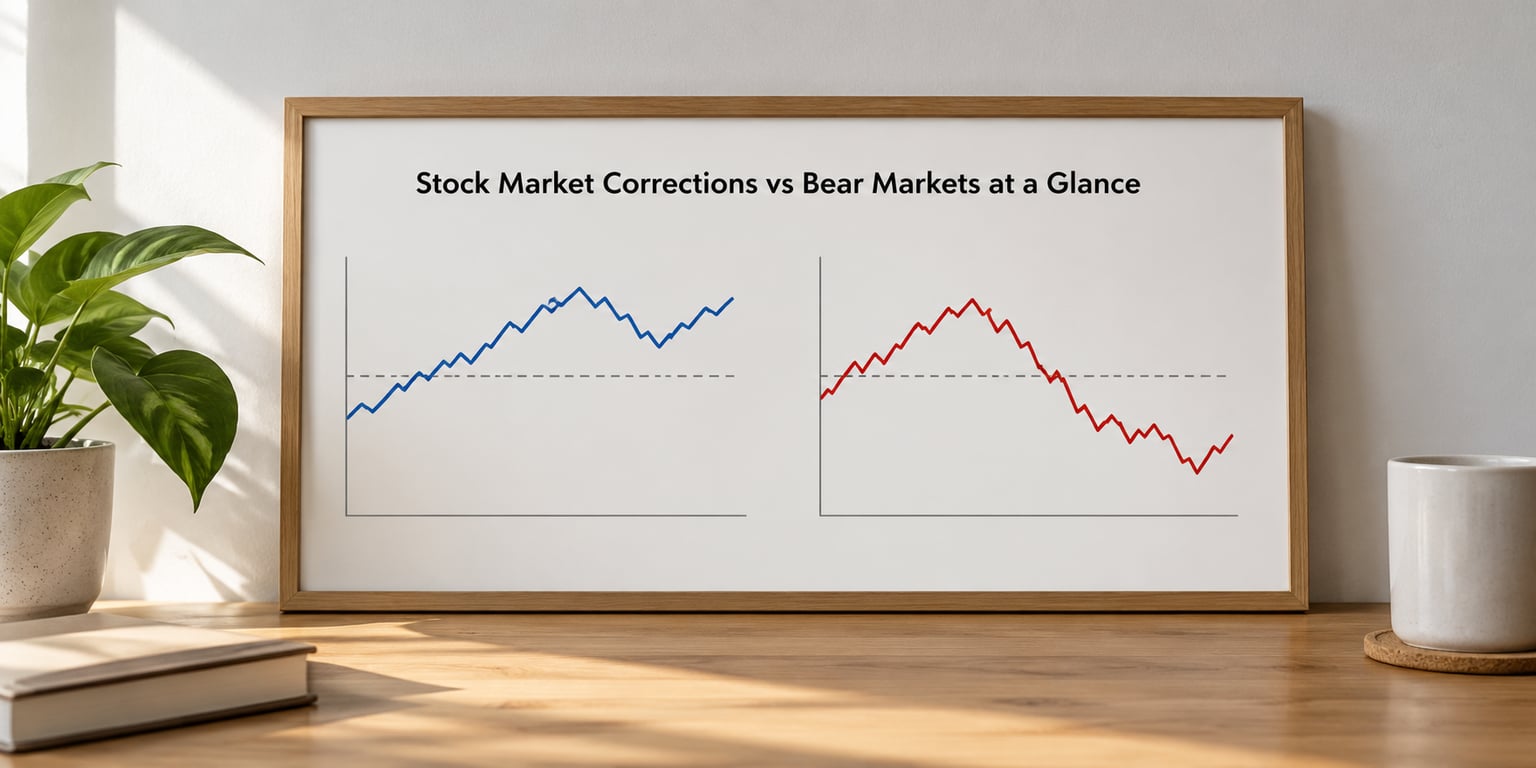
| Measure | Pullback | Correction | Bear market |
|---|---|---|---|
| Decline from recent peak | 5% to 10% | 10% to 20% | 20% or more |
| Typical cause | Routine profit-taking | Valuation multiple compression | Multiple compression plus falling earnings |
| Speed | Days to a few weeks | Usually weeks, sometimes months | Can unfold over 12 months or more |
| Typical time to a bottom | Weeks | Roughly two to five months | Roughly 12 to 19 months |
| Time to recover to prior peak | Often none needed | Typically under a year | Often 2 to 5 years; longer for deep bears |
| Historical frequency | Several times a year | Roughly once a year or so | Roughly once every five to six years |
| Typical market breadth | Narrow | Mixed | Broadly weak |
| Media framing | Seldom covered | Widely covered, alarming tone | Front-page coverage for months |
| Economic backdrop | Expanding | Usually still expanding | Often slowing, not always contracting |
| What it does not guarantee | A larger decline is unlikely but possible | A return to all-time highs | A recession or a fast recovery |
The most useful row in that table is the last one. Neither label is a forecast. A correction does not promise the prior high comes back within a quarter, and a bear market does not promise a recession or a quick bounce.
What Are Stock Market Corrections and Bear Markets?
Both terms describe a decline measured the same way: from the index’s most recent high to its subsequent low. What changes is how deep that decline goes.
- Pullback — a decline of roughly 5% to 10% from a recent peak. In a normal year this happens several times and usually makes no news.
- Correction — a decline of 10% to 20%. The word implies prices got ahead of themselves and came back toward a more defensible level.
- Bear market — a decline of 20% or more. The conventional label carries an assumption that something changed in the underlying business, not just in investor mood.
- Crash — a fast, severe decline, often 20% or more in a very short window. Crash describes speed as much as size, so a 22% drop spread over two years is a bear market while a 22% drop in five weeks is usually called a crash.
What Counts as a Correction or a Bear Market?
Conventionally, the measure is peak-to-trough on a broad US index, most often the S&P 500, measured from the all-time high. The 20% line is a convention rather than a law, and individual stocks routinely fall 20% or more in months when the index does not.
Because the number is a convention, confirmation is what makes it stick. Analysts say a bear market is in place once the decline is confirmed across price, breadth and economic data, which is why headlines tend to arrive weeks after the trough rather than at it. Two people comparing figures can also disagree about the reference point: the all-time high and the cycle high are often different dates.
How Do Corrections and Bear Markets Differ?
The gap between them is widest in duration and recovery time, not in the initial percentage drop.
Corrections tend to be shallow and quick. Hartford Funds and Clearnomics research commonly cited in financial media put the average correction at roughly a 10% to 14% decline lasting about two months, with recovery to the prior high usually inside a year. Roughly one correction a year is a fair long-run expectation, and in active years there can be two or three.
Bear markets are rarer and longer. Research summarized by aAdvisor puts the average bear market at about 14 months and a total return near -33%, with the average decline since 1950 running close to a third. Other trackers counting episodes back to 1942 land near 15 bear markets in 84 years, which is about one every five to six years.
What Actually Separates the Two Beyond the Number?
Earnings. Yardeni Research popularized the distinction many analysts still use: corrections are panic attacks the fundamentals do not validate, driven by falling price-to-earnings multiples while earnings keep growing. Bear markets involve falling earnings as well as lower multiples, which is why they take so much longer to work through.
The arithmetic of recovery is where stock market corrections vs bear markets separate most clearly in dollars. A 10% loss needs an 11% gain to break even. A 20% loss needs 25%. A 30% loss needs 43%. A 50% loss needs 100%. On a hypothetical 100-unit portfolio, dropping to 80 leaves you 20 units short, and clawing that back means earning 25% on a smaller base.
What Causes Corrections and Bear Markets?
Causes are usually a combination rather than a single event, and it is worth separating what is plausible from what is predictable. Nothing in the list below reliably signals what comes next.
- Valuation and interest rates — a run of strong returns can push multiples up; when real yields rise, those multiples compress. This is the classic correction engine.
- Inflation and Fed policy — a Federal Reserve that tightens longer than expected raises the discount rate applied to future earnings. Rate-cut hopes that evaporate can do the same damage quickly.
- Earnings weakness — revenue misses, margin pressure or downward revisions. This is what pushes a correction into a bear market, and it is the ingredient missing from most corrections.
- Recession fear — markets trade on expectations, so a slowdown can be priced in before the data confirms it.
- Financial stress — credit spreads, funding costs and leverage unwinding. This is where 2008 belongs.
- Geopolitical shocks — the 2020 pandemic sell-off is the clearest example, and it produced a decline that met the bear market threshold in weeks.
- Concentration — when a handful of large companies carry a large share of index weight, a problem at one of them moves the whole index.
One thing worth knowing about the 20% line: it was popularized in the 1960s by Alan Shaw at Smith Barney and picked up as shorthand afterwards. Some analysts argue it fits today’s index poorly, since a heavily weighted index can move further on a milder earnings shock than it used to. That is an argument about the convention, not about whether declines hurt.
How Should Investors Respond to Each?

Start by checking cash needs, not the index. When stock market corrections vs bear markets show up in your account, the decision changes depending on whether the money is needed in three months or twenty years, and that single fact matters more than any label the market is given.
During a correction, most people need consistency rather than a new plan. Confirm your spending reserve covers the next two to three years so the portfolio is not the source of emergency funds. Rebalance if positions have drifted away from your targets — that sells some of what has run up and buys what has not, which is a mechanical way to act without forecasting. If you invest on a schedule, keep investing on it; the purchase price is lower, which is the whole point of the arithmetic above. Write down what you are doing and why, because the writing is what stops an emotional exit three weeks later.
During a bear market, the work is broader and slower. Review whether your allocation still matches your time horizon, since a portfolio built for growth does not survive a 50% drawdown in retirement accounts the same way it does in a working career. Check that concentrated positions are positions you can hold through a longer decline rather than ones sized for a good market. Look at whether any near-term goals, a home purchase or a planned retirement date, are exposed to a specific date, and move those to cash or short-duration holdings if they are. Consider tax-loss harvesting only if you have offsetting gains and the time to manage it.
Retirees and near-retirees face a distinct risk called sequence of return risk. Two portfolios can end at the same average return and land in very different places depending on the order of their returns. A decline in the first years of retirement, when withdrawals are being taken from the portfolio, is more damaging than an identical decline twenty years in, because there are fewer years left to recover. That is why cash reserves and bond allocations carry more weight close to and during retirement, not because stocks are bad but because the sequence matters.
A note on language, since this is the most common source of confusion in forum threads: headlines freely mix “correction,” “crash,” “sell-off” and “bear market” for the same move. Retail investors describe it accurately when they point out that a 12% drop gets a correction label and a 19% drop gets a crash headline. The measurable rule is the one in the table above.
What does not help is panic selling at the level the decline has already produced, then watching the index recover within months. That regret pattern shows up repeatedly in discussions on r/stocks and r/finance, and it is the reason people write about these events years later instead of the returns they missed.
Can a Correction Turn Into a Bear Market?
Yes, sometimes. The relationship runs one way: every bear market begins with something that looked like a correction, but most corrections never get there.
You can run a two-minute check on where things stand right now. First, find the index’s most recent all-time high and calculate the decline from it to the latest close. Second, look at breadth, specifically how many stocks are below their own 200-day moving average, since a correction with narrow breadth is usually narrow in cause. Third, watch earnings revisions, because rising estimates alongside falling prices is correction behavior, while falling estimates is the shift that matters.
Even all three together do not confirm the outcome. The 2020 pandemic decline hit the 20% bear market line in about five weeks and the index was back near its old high within the year, because policy support offset the earnings shock. A slower decline driven by falling profits, as in 2000 to 2002 or 2008, resolves far more slowly.
How Do Investors Know When a Bear Market Has Ended?
Technically, when the index closes back above its prior peak. Practically, markets give earlier signals, and none of them is conclusive on its own.
- Breadth improving — a rally led by a handful of mega-cap names with most stocks still below trend is weaker evidence than broad participation.
- Earnings revisions turning positive — analysts stabilizing estimates is a fundamental counterweight to falling multiples.
- Economic data — labor, claims and manufacturing readings stabilizing, or a recession ending sooner than feared.
- Price trend — a higher high above the prior swing low tells you the downtrend has broken, even before the old peak returns.
Two warnings belong here. Markets routinely rebound 10% or more before the underlying data improves, and that rebound is not the same as the trend reversing. And a retest of the prior low after a first bounce is common, which is why a recovery that looks finished in the first quarter can take four quarters to finish.
Which Should You Choose?
This question is usually asked wrong. Nobody chooses a market decline, and the label attached to it does not change the best course for a given investor.
Long-term, broadly diversified investors with a horizon measured in decades can treat either decline as a scheduled review: confirm cash reserves, rebalance, keep contributions going. The main risk for this group is acting on the decline rather than acting on the plan.
Investors with money needed within two years have a different priority, and no decline label makes that money safer. Holding it in something that can fall 40% is a mismatch regardless of what the index is called today.
Retirees drawing income face the sequence of return problem, which makes the timing of the first decline more consequential than its size. Near-retirees within roughly five years of needing withdrawals should generally lean toward the liquidity discussion rather than the entry-point discussion. Short-term traders are making a different job with their capital entirely, and neither a correction nor a bear market is a tradeable event without a system behind it.
For everyone else, the honest answer is that the label does not change the decision. The decline’s size, the time horizon, and the cash needs do.
Frequently Asked Questions
Is a 10% stock market decline always a correction?
Not quite. A decline of 10% to 20% from a recent peak is conventionally called a correction, so a drop of exactly 10% sits right on the boundary. It also depends on the reference point: a 10% fall from an all-time high reads differently from a 10% fall from a lower recent peak. Pullbacks under 10% and declines past 20% use different labels entirely.
Can the stock market recover from a bear market quickly?
Yes, sometimes, and it is worth planning for slow rather than fast. The 2020 pandemic decline crossed the 20% line in about five weeks and the index was back near its old high within roughly a year. Others have been far slower: the average bear market runs near 14 months to a bottom, and recovering the prior peak often takes two to five years.
Should investors sell during a correction or a bear market?
Selling after a decline locks in the loss and means buying back at a higher price if the market recovers, which is the most common regret pattern long-term investors describe. Selling before one is a different decision entirely and depends on your time horizon. The practical alternative to guessing is confirming your cash reserve, rebalancing toward targets, and continuing scheduled contributions.
Does a bear market always mean a recession?
No. A recession is an economic contraction, commonly measured as two consecutive quarters of declining GDP, and it is measured on output rather than stock prices. Many bear markets occur while the economy keeps growing, and recessions can begin without a 20% index decline. Markets price expectations, so an economic slowdown can be reflected in prices before it shows up in GDP data.
Can an individual stock enter a bear market while the broader market does not?
Yes, and it happens constantly. The 20% threshold is a convention for broad indexes, not a rule applied to single securities. A company can lose a quarter of its value on weak guidance, a lost contract or a diluted share count while the index barely moves. That is also why a diversified index fund behaves very differently from a portfolio of a few individual positions in a downturn.
Conclusion: Start With the Decline, Not the Label
Stock market corrections vs bear markets is a distinction of size, and size is only half of what matters. A correction is a 10% to 20% drop usually driven by valuation and usually repaired within months. A bear market is a 20% or larger drop that usually involves falling earnings, takes years to recover, and can break a plan built on the assumption it will not happen.
Neither one tells you what comes next, and neither one changes what a sound plan already says. Start where the actual work is: check that your cash reserve covers the next few years, confirm your diversification matches your time horizon, be honest about how much temporary decline you could tolerate without selling, and verify that the plan you are holding in 2026 still fits the life it is funding.