
Dividend yield is a snapshot: the annual dividend per share divided by today’s price. Dividend growth is a rate: how quickly that dividend has been rising year after year. The first tells you what you collect now, the second tells you what your income could look like in fifteen years, and the better one depends almost entirely on how long you plan to hold.
Most of the confusion around this topic comes from quoting both numbers as a percentage. A yield of 6% and a growth rate of 6% are not remotely the same promise, and treating them as interchangeable leads people into bad purchases. The measure you should lean on changes with your age, your withdrawal needs and your tolerance for a dividend cut.
This is educational information, not personalised financial advice. Tax treatment and fund availability vary by country and by account type, so check the details for where you live.
Table of Contents
- Dividend Yield vs Dividend Growth at a Glance
- What Is Dividend Yield?
- What Is Dividend Growth?
- Dividend Yield vs Dividend Growth Explained with an Example
- Why the answer flips with your time horizon
- What the example leaves out
- How Dividend Yield and Dividend Growth Affect Your Investment
- Why a high dividend yield can be a value trap
- Yield on cost is where dividend growth shows up
- How much capital you need for a fixed yearly income
- REITs, MLPs and preferreds are not comparable
- Inflation quietly shrinks a flat payout
- Which Should You Choose?
- Lean toward a higher yield when
- Lean toward dividend growth when
- Blend both with a core and satellite portfolio
- Dividend safety checklist before you buy
- Taxes and account type can change the answer
- Frequently Asked Questions
- Is a higher dividend yield always better?
- What is a good dividend growth rate?
- Should I choose dividend yield or dividend growth?
- How do I calculate dividend growth over several years?
- Does a high dividend yield mean the company is financially strong?
- Can dividend growth and dividend yield be used together?
- Conclusion
Dividend Yield vs Dividend Growth at a Glance
The comparison below lines up the two measures on the criteria that actually change your decision.
| Criterion | Dividend yield | Dividend growth |
|---|---|---|
| What it measures | Annual dividend per share divided by the current share price | The yearly increase in dividend per share, usually shown as a multi-year compound rate |
| Time horizon | Today, though the price moves constantly | Five to twenty-five years of history |
| Direction of travel | Can jump up or down without the dividend changing at all | Slower and steadier, but it can reverse if a company cuts the payout |
| Main risk | Buying a falling share for a headline yield, then eating a cut | Paying a full price for growth that never arrives |
| Income today | Higher | Lower |
| Best for | Retirees and near-retirees drawing income to cover bills | Long-horizon investors reinvesting or building total return |
| Where you see it | Screens, fund fact sheets, most stock quote pages | Dividend history tables, long-term annual increase records |
Read the table twice and one point stands out. Dividend yield is backwards-looking in the sense that it is anchored to a price the market set today, while dividend growth is anchored to a management track record measured over decades. Neither one alone tells you whether a payout is safe.
What Is Dividend Yield?
Dividend yield is the annual dividend per share divided by the current share price, expressed as a percentage. If a share costs 100 dollars and pays 4 dollars a year, the yield is 4%.
Beginners mix this up with the annual return all the time, so it is worth being blunt: a 4% yield means the payout equals 4% of the purchase price for one year. It says nothing about whether the share price rose or fell over that year.
The number also moves for a reason that has nothing to do with the company. If the share price falls 30% while the dividend stays flat, the yield jumps sharply without a single extra dollar being paid. That is why a suddenly spectacular yield often accompanies bad news.
Two versions show up in practice. The trailing yield uses the last twelve months of payouts. The forward yield uses the declared annual dividend, usually the most recent quarterly figure multiplied by four, and is what most screening tools show.
What Is Dividend Growth?
Dividend growth is the rate at which a company raises its dividend per share from one year to the next. The simple year-on-year formula is (new dividend minus old dividend) divided by old dividend. Over longer periods investors use the compound annual growth rate across three, five or ten years, which smooths out one-off jumps.
The rough benchmark bands are stable. A dividend growth rate of 3% to 5% is solid and roughly tracks inflation plus a little. Between 5% and 8% is strong. Anything above 8% is rare and worth scrutinising for a one-off base effect, a cyclical peak or a payout stretched close to earnings.
The companion signal is the increase streak, the number of consecutive years of raises. A company in the S&P 500 Dividend Aristocrats has raised its dividend for at least 25 consecutive years, which says more about durability than any single year’s growth rate.
Dividend Yield vs Dividend Growth Explained with an Example
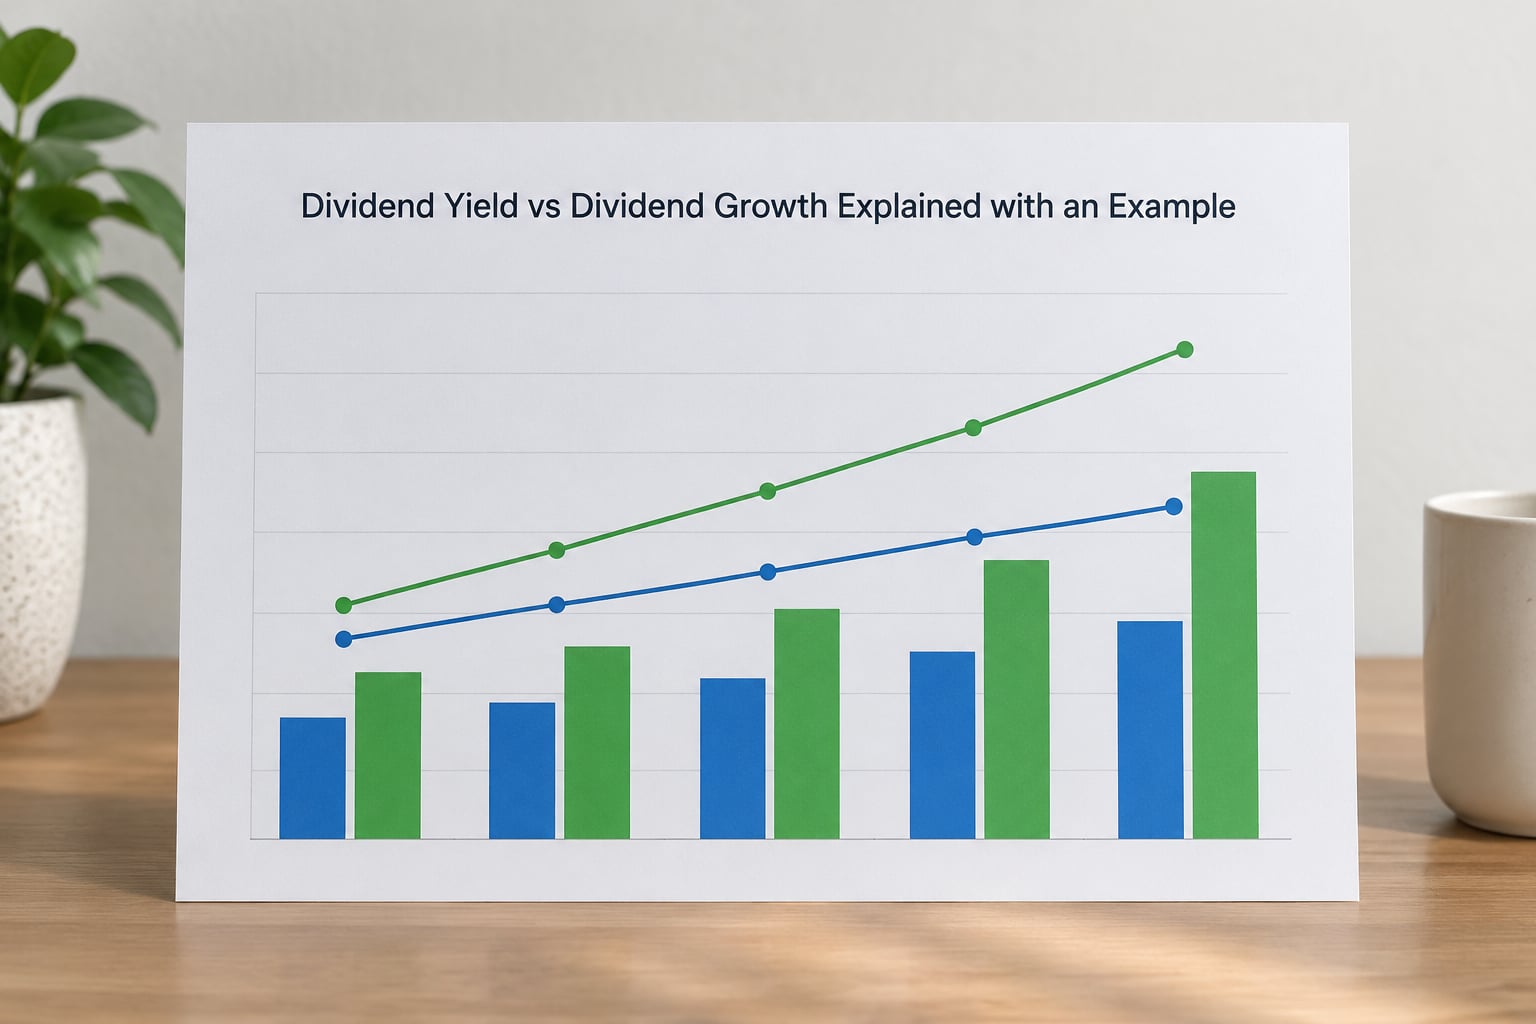
Take two fictional payers. Company A yields 6% and holds its dividend flat. Company B yields 2% and raises its dividend 8% a year. Both start with 100,000 dollars invested.
| Year | A: flat 6% income | B: 2% growing 8% | Which pays more |
|---|---|---|---|
| 1 | 6,000 | 2,000 | A |
| 5 | 6,000 | 2,721 | A |
| 10 | 6,000 | 3,998 | A |
| 15 | 6,000 | 5,874 | A |
| 20 | 6,000 | 8,631 | B |
| Total over 20 years | 120,000 | 91,524 | A by 28,476 |
The crossover lands in year 16. In year 15, Company B pays 5,874 against Company A’s 6,000; a year later it is ahead and stays ahead, pulling further away every year after that. Over a twenty-year retirement draw, the flat payer wins on cumulative income, 120,000 against 91,524. Over a thirty-year holding period with reinvestment, the growing payout overtakes it earlier and compounds harder.
Why the answer flips with your time horizon
The crossover year depends on the size of the starting gap and the growth rate. Double the growth rate to 16% and the crossover arrives around year nine. Cut growth to 3% and you would wait roughly thirty-five years for B to catch A.
That is the single most useful thing to understand here. The forum consensus on r/drip_dividend puts it plainly: high yield wins short-term income, growth wins long-term income, and the crossover depends entirely on the growth rate.
What the example leaves out
Three things. Neither model includes share price change, which is usually the largest part of total return over a decade. Neither includes tax, which for most investors is a real drag on the payout. And neither includes a dividend cut, which is the risk that actually decides whether either line holds.
How Dividend Yield and Dividend Growth Affect Your Investment
Why a high dividend yield can be a value trap
A value trap is a share that looks cheap on income and stays cheap for a reason. The usual chain runs: earnings fall, the share price falls, the yield rises, income investors pile in, and then the board cuts the dividend to protect the balance sheet.
Signals worth treating seriously: a payout ratio climbing toward or above earnings, free cash flow no longer covering the dividend, debt-to-equity rising fast, and a business whose earnings track commodity prices or credit cycles. Cyclical sectors such as energy, banks and telecoms produce most of these traps.
Balance-sheet evidence is where the two approaches separate. Data from S&P Global’s index work puts debt-to-equity at 40.4% for the S&P High Yield Dividend Aristocrats index against 49.6% for the S&P 500 High Dividend index. The high-yield group carries more leverage and a lower-quality earnings base, which is precisely the group facing a cut when the cycle turns.
Yield on cost is where dividend growth shows up
Yield on cost is your annual dividend divided by what you originally paid, not by today’s price. It is the honest scoreboard for a dividend growth holding.
Buy a share at 100 dollars yielding 2%, let the dividend rise 8% a year and hold for fifteen years. The dividend per share has roughly tripled, and on a purchase price of 100 dollars the yield on cost is now above 6%. Investors posting on r/dividends routinely report yield on cost figures in the 8% to 25% range after a decade or two this way, against a current yield of 1% to 2%.
A flat 6% payer never produces that line in the spreadsheet. Its yield on cost drifts toward its current yield as the price moves.
How much capital you need for a fixed yearly income
For readers targeting a specific income figure, the required capital divides out simply: annual income target divided by yield.
| Target annual income | At 2% yield | At 3% yield | At 5% yield | At 7% yield |
|---|---|---|---|---|
| 10,000 | 500,000 | 333,333 | 200,000 | 142,857 |
| 30,000 | 1,500,000 | 1,000,000 | 600,000 | 428,571 |
| 60,000 | 3,000,000 | 2,000,000 | 1,200,000 | 857,143 |
| 100,000 | 5,000,000 | 3,333,333 | 2,000,000 | 1,428,571 |
| 120,000 | 6,000,000 | 4,000,000 | 2,400,000 | 1,714,286 |
The row most people search for is the one at 100,000 a year, and the 120,000 row covers the monthly-income version of the same question. A 10% yield would halve those capital figures again, which is another good reason to treat a 10% yield as a warning rather than a gift.
Frame the target against a safe withdrawal rate instead. A 4% starting yield gives a 4% withdrawal rate on the income-producing portion of a portfolio, which is the classic benchmark retirees use. A 2% grower needs roughly twice the capital to produce the same cash, but that capital sits in businesses with higher quality and more headroom.
REITs, MLPs and preferreds are not comparable
A listed REIT, a master limited partnership and a preferred share all produce headline yields well above the 2% to 4% range you see in ordinary dividend payers. Their distributions are structurally different: REITs pass through rental income, MLPs are commonly structured as partnerships for tax purposes, and preferreds sit ahead of common shareholders in the queue.
Compare a 9% MLP distribution with a 3% dividend payer and you are comparing two different things. Judge each on its own coverage ratio, debt load and tax treatment rather than against a shared benchmark.
Inflation quietly shrinks a flat payout
A flat 6% payout loses about 45% of its purchasing power over twenty years at 3% annual inflation. A 6% yield that grows its dividend 4% a year roughly holds its ground. This is the practical case for growth, and it applies to every household expense from groceries to council tax.
Which Should You Choose?
Lean toward a higher yield when
- You are drawing income to cover living expenses now, and cash flow arriving this quarter matters more than next year’s increase.
- Your horizon is short, so there is little time for growth to compound.
- You are replacing bond income and value bond-like stability over income growth.
- You have a low tolerance for a share that trades sideways for a decade while the dividend grinds upward.
Lean toward dividend growth when
- You have 15 or more years and can reinvest, which lets a DRIP do the work.
- You are building total return and want quality balance sheets on top of it.
- You want the payout to outpace inflation without renegotiating anything each year.
- You value a long increase streak as evidence of a durable cash-generating business.
Blend both with a core and satellite portfolio
The honest answer for most readers is that the two measures do different jobs, so use both. Hold a core of well-capitalised growers for the compounding engine, then add a smaller income sleeve sized to the cash you actually need each year.
This structure also answers the question that comes up repeatedly in dividend communities: hold low-yield compounders and switch to high yield at retirement, or buy high yield now? Starting the income sleeve earlier costs less capital and lets the growth sleeve keep running.
Dividend safety checklist before you buy
- Check the payout ratio: below 60% is generally comfortable, above 80% on a cyclical business is a warning.
- Confirm free cash flow covers the dividend, not just accounting earnings.
- Look at the increase streak and whether the last raise was small or reversed.
- Compare debt-to-equity and interest coverage against the company’s own history, not a single number.
- Ask why the yield is high. No answer is information too.
- Check whether the payout happens quarterly or annually, and whether the account type holds it tax efficiently.
Taxes and account type can change the answer
Qualified dividends are generally taxed at long-term capital gains rates in the US, with holding-period and account rules that apply. In the UK, dividend income sits above the personal allowance and is taxed differently from capital gains. That difference matters more than most people expect when you compare a 3% yield taxed at a lower rate against a 5% yield taxed at a higher one.
Fund wrappers also change the picture. Index and exchange-traded funds generally cost less than the equivalent individual holdings, and some are more tax efficient depending on how they are traded and where they sit in your account.
Frequently Asked Questions
Is a higher dividend yield always better?
No. A high yield often reflects a falling share price or a payout stretched close to earnings, and both can end in a dividend cut. Compare the yield with the payout ratio, free cash flow coverage and debt before treating it as an advantage. A lower yield backed by a 25-year increase record is usually the safer holding.
What is a good dividend growth rate?
For most mature companies, 3% to 5% a year is solid, 5% to 8% is strong, and anything above 8% deserves closer scrutiny because it may reflect a low base year rather than a repeatable trend. Judge it over a five or ten-year compound rate, not a single year.
Should I choose dividend yield or dividend growth?
Choose yield if you need cash now and your horizon is short. Choose growth if you have 15 years or more and can reinvest. Many investors combine them: a growth core for compounding plus an income sleeve sized to cover near-term spending. The right split depends on your withdrawal needs, not on which number looks better.
How do I calculate dividend growth over several years?
Take the dividend per share from year one and the dividend per share from the final year, raise the ratio to one divided by the number of years, then subtract one. For example, a dividend rising from 1.00 to 1.50 over five years gives 1.5 to the power of 0.2, minus one, or about 8.4% a year.
Does a high dividend yield mean the company is financially strong?
It does not, on its own. Yield is a ratio where the denominator is a market price, so it climbs whenever the price falls. A company can show a 9% yield and still be cutting its dividend. Financial strength shows up in the payout ratio, free cash flow coverage and leverage, not in the headline yield.
Can dividend growth and dividend yield be used together?
Yes, and most dividend portfolios use both. Yield tells you the income arriving now, growth tells you the direction of that income, and yield on cost shows what the two produced together over your holding period. Read them as three separate numbers rather than competing scores.
Conclusion
Dividend yield and dividend growth answer two different questions. Yield tells you what a share pays relative to its price today, and it rises when the price falls. Growth tells you how fast management has raised the payout, and it is the only one of the two that keeps working while you wait.
Start with a short checklist. Work out the annual income you actually need, then size the capital at a realistic yield rather than the best one you can find. Check the payout ratio and free cash flow coverage on every candidate. Track the increase streak. Watch yield on cost as your own portfolio’s scoreboard, since that is where a decade of compounding shows up.
One caution before you go further. Rates, tax rules and payout policies all change, so re-check the numbers behind any example like the ones above rather than treating them as permanent.