
An ETF prospectus is the SEC-required legal disclosure document for an exchange-traded fund, and it states the fund’s investment objective, strategies, principal risks, fees, holdings and management. Reading one does not mean reading every page of legal text; it means finding the objective, the fee, the portfolio and the risk language, then deciding whether that fund matches what you thought you were buying.
Here is how to read an etf prospectus in the order that actually helps. Ten minutes on the summary page and the fee table tells you more than an hour of skimming disclaimers, and once you know which sections carry decision-relevant facts, the rest becomes optional.
This guide covers US-listed ETFs and funds registered with the Securities and Exchange Commission under the Investment Company Act of 1940. It is general information, not individualized investment advice, and fund rules, fee structures and tax treatment change over time. Check the current filing for your specific fund.
Table of Contents
- What You Need
- Step-by-Step: How to Read an ETF Prospectus
- How to Read an ETF Prospectus from Cover to Cover
- 1. Identify the Fund’s Investment Objective and Strategy
- 2. Review the Fund’s Holdings and Portfolio Exposure
- 3. Compare Fees, Expenses, and Trading Costs
- 4. Understand Performance and Benchmark Information
- 5. Read the Risk Disclosures
- 6. Check Turnover, Tracking, and the Fund’s Operational Disclosures
- Common Mistakes
- Tips for Using an ETF Prospectus
- Frequently Asked Questions
- Do you actually need to read an ETF prospectus?
- How do I find an ETF prospectus online?
- Should I read the summary prospectus or the full statutory one?
- How long does an ETF prospectus take to read?
- How do I know my prospectus is the current version?
- What is tracking error and why does it matter in a prospectus?
- Conclusion: Start With the Summary
What You Need
Four things are enough. Everything else is optional convenience.
- The current prospectus. Download it from the fund issuer’s own site or from SEC EDGAR, not from a blog or an aggregator that may be hosting a stale copy.
- The fund’s summary page. Most issuer pages carry a condensed one-page factsheet with holdings, net asset value and premium or discount. It is a shortcut, not a substitute.
- A calculator or spreadsheet. You want to annualize a fee over your holding period and compare two funds side by side.
- A clear idea of the goal. Growth, income, crisis hedge, day trading. The prospectus only answers whether the fund matches a goal you have already named.
Know upfront that SEC filings run long. A summary prospectus is typically under ten pages; a statutory prospectus for an ETF is often somewhere around 60 to 100 pages of legal and disclosure text, with the genuinely useful content concentrated in the first 10.
You do not need to read line by line to get the decision-relevant facts. What you do need is the fee table, the principal risk summary, the investment strategies language and, for anything that is not a plain-vanilla index tracker, the portfolio and derivatives sections.
Step-by-Step: How to Read an ETF Prospectus
Work in this order: confirm you have the right document and the current version, read the objective, look at what the fund owns, price the cost, check the performance period, then read the risks. Each step answers a question the next one depends on.
How to Read an ETF Prospectus from Cover to Cover
The cover page tells you which fund, which share class, and which document version you are holding. Confirm the fund name matches what you meant to buy, read the date, and check the ticker.
ETFs ship with a document set, and picking the wrong one is the most common wasted afternoon. The summary is the readable one. The statutory version holds the full legal text. The Statement of Additional Information carries the operational detail.
| Document | Typical length | What it holds | Read it when |
|---|---|---|---|
| Summary prospectus | Under 10 pages | Objective, fees, principal risks, past performance | Always, first |
| Statutory prospectus | Roughly 60 to 100 pages | Full legal disclosure, strategies, policies, purchase and sale of fund shares | Before buying any fund that is not a plain index tracker |
| Statement of Additional Information | 30 to 60 pages | Portfolio managers, fund operations, securities lending, tax details | When you want to know who runs the money and how |
Once you have the right file, triage it. This table is the part most readers find genuinely useful, because it tells you how much time each section deserves.
| Section | What to look for | Red flag | Time cost |
|---|---|---|---|
| Fees and expenses | Management fee, total annual fund operating expenses, any fee waivers | Acquired fund fees pushing the total up without explanation | 3 minutes |
| Principal investment strategies | Asset classes, concentration limits, derivative or option use | Wording so broad it permits almost anything | 5 minutes |
| Principal risks | The summary risk list at the front, then detail | A thin risk section for a fund doing unusual things | 4 minutes |
| Average annual total return | Start date, end date, benchmark column | A short history covering one unusually good year | 3 minutes |
| Purchase and sale of fund shares | Premium and discount to net asset value, bid-ask spread, creation and redemption | Wide spreads or a small average daily trading volume | 4 minutes |
| Securities lending | Collateral, revenue share, whether lending is permitted | Lending revenue flowing into the fund’s fee line | 2 minutes |
| Management and adviser | Who runs it, how long, firm AUM | A tiny team on a fund you are adding to heavily | 2 minutes |
1. Identify the Fund’s Investment Objective and Strategy
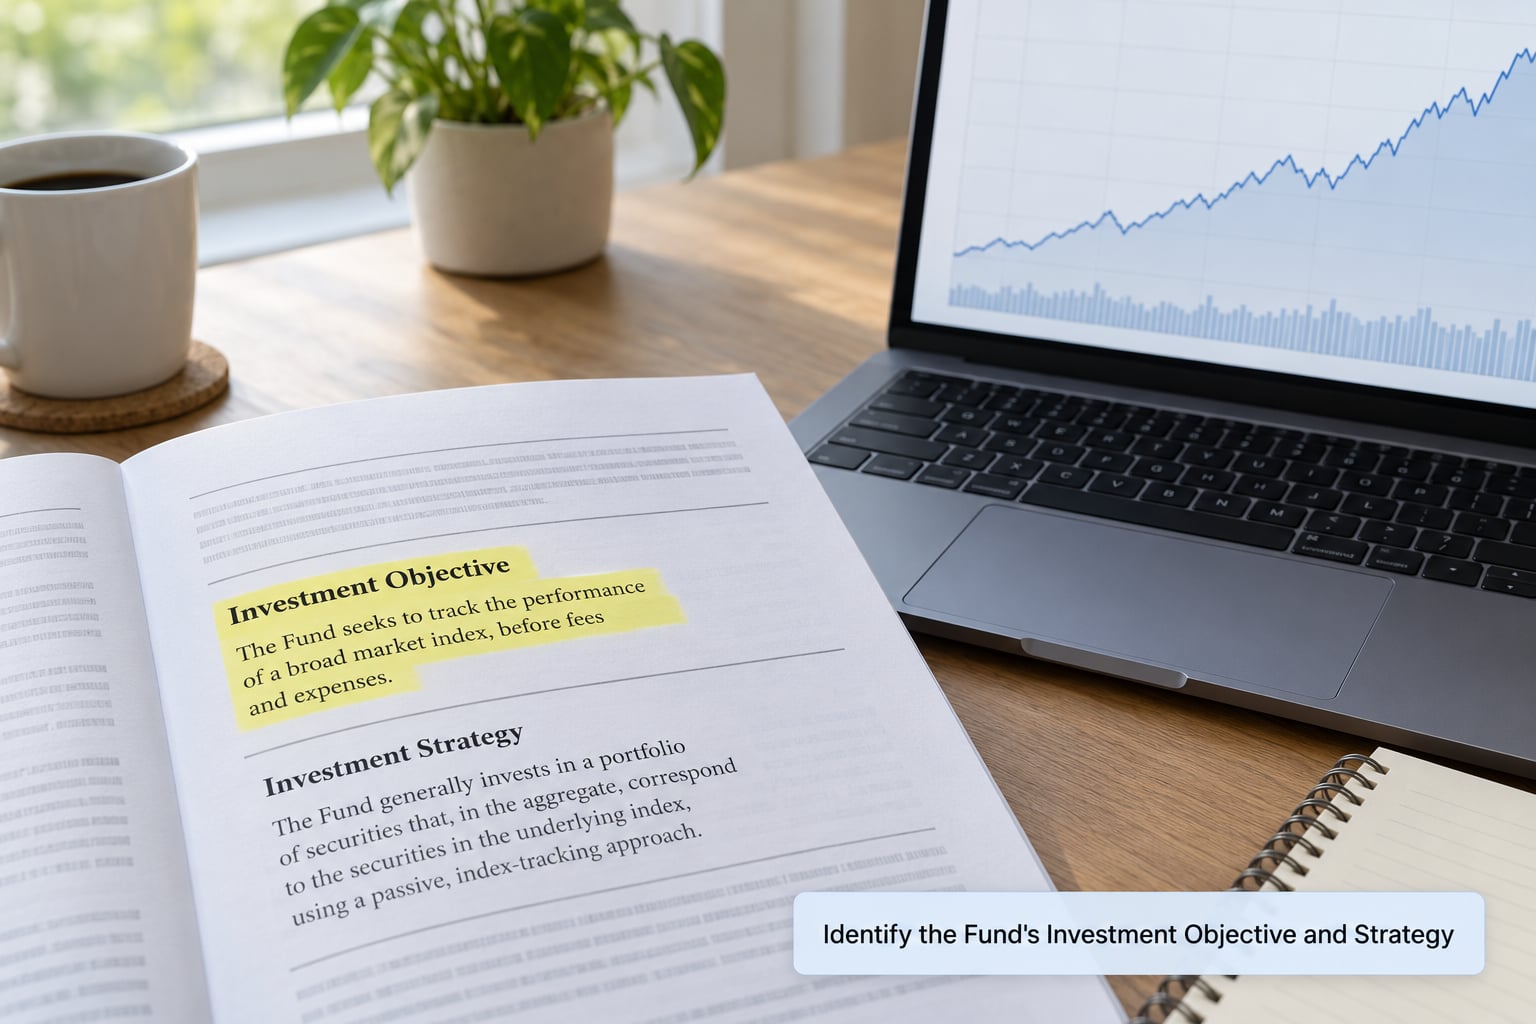
The objective is one sentence and it decides whether the rest of the document is worth your time. If the fund does not do what you want, nothing below that line changes the answer.
Then read the strategy language, which is where the real information lives. Note the benchmark or tracking index, the asset classes, the geographic focus, and whether this is passive or active.
Translating a broad objective into something concrete is the skill here. An objective that says the fund seeks to track a broad large-capitalization US equity index means the fund owns a cross-section of large US companies in roughly index weights, not the handful of names you happen to recognize. The strategy paragraph tells you the sampling method and whether the fund holds every constituent.
Check three words carefully: primarily, may and up to. Those are the legal hinges. A fund that may invest up to a stated percentage of net assets in an unusual instrument is telling you it holds that instrument, not that it might someday consider it.
2. Review the Fund’s Holdings and Portfolio Exposure
The strategy description tells you what the fund intends to do; the holdings and annual portfolio disclosures tell you what it actually owns. Those are different documents updated on different schedules, which is exactly why people get surprised.
Look for sector concentration first. A fund labeled as a broad index tracker can still hold a large share of one sector, and a single-theme fund will almost always concentrate heavily. Then look at individual-name exposure, because a fund holding 30 securities behaves very differently from one holding 3,000.
Also check the geographic line. A US equity label can still hold meaningful international exposure, and a global fund may hold a heavy US tilt.
Three more lines deserve a look: cash and cash equivalents, which may run higher than you expect; derivatives, including options, futures and equity-linked notes; and anything the fund holds that does not behave like its headline label suggests. In a widely shared r/dividends walkthrough of an income ETF prospectus, the author found the disclosure that the fund may invest a stated percentage of its net assets in equity-linked notes on an early page, then traced that line to counterparty and credit risk. The marketing material for that fund said nothing about notes. That gap is the reason this step exists.
Equity-linked notes are debt instruments whose value is linked to an equity index. Owning one means taking on the credit risk of the bank that issued it, not just the equity exposure it references.
3. Compare Fees, Expenses, and Trading Costs
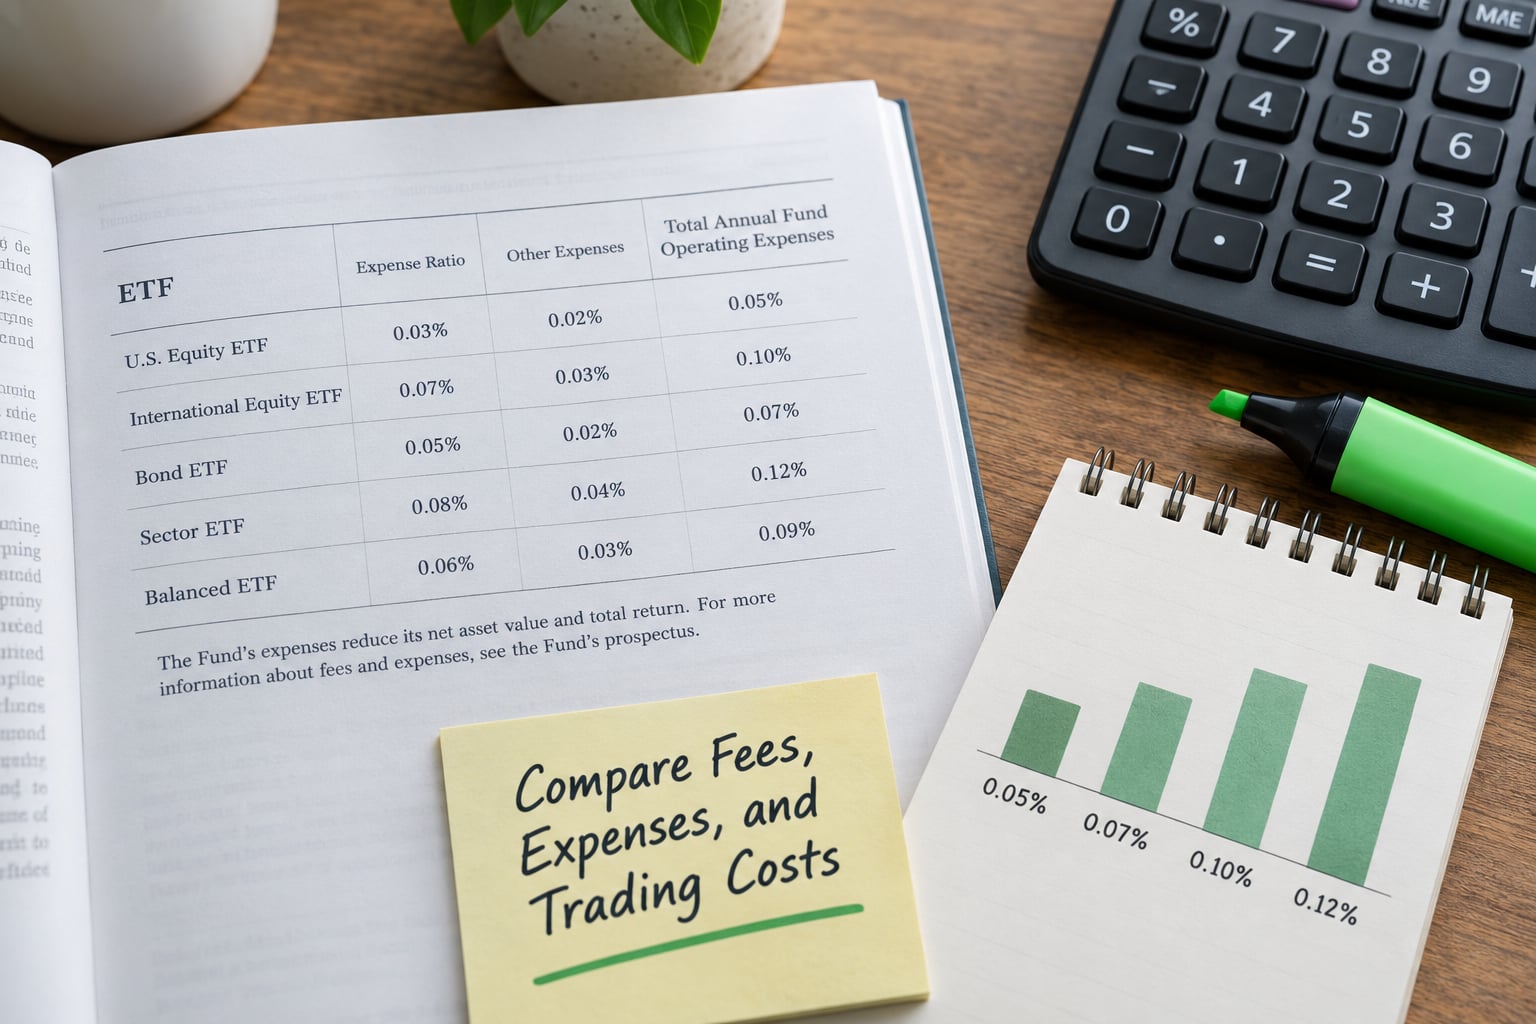
The expense ratio is the annual percentage of fund assets charged for operating the fund, taken from assets rather than billed to you. It is the single most comparable cost figure across funds, and it is not the only cost you pay.
Your total cost has four parts, and only the first appears as a ratio.
- Annual fund operating expenses. Management fees, administrative costs, and any 12b-1 distribution or marketing fees, all rolled into one total figure.
- Acquired fund fees and indirect costs. When a fund holds other funds, you can pay a slice of their expenses too.
- Trading costs. Brokerage commission, and more importantly the bid-ask spread you cross each time you buy or sell.
- Taxes. Distributions are taxed differently depending on whether they come from dividends, interest, options premiums or realized capital gains. ETF structures can create capital gains distributions even when you did not sell anything.
Why two funds with nearly identical portfolios cost different amounts: the difference usually sits in the fee waivers, the acquired fund fees, the trading costs of the strategy, and the tax character of the distributions.
Use the hypothetical return illustration to feel the drag. SEC rules require funds to show what a hypothetical 10,000-dollar investment would have grown to over one, three, five and ten years, at the fund’s stated return rate with fees deducted. Compare that net column against the same illustration for a similar fund, and the difference shows you what the fee gap does to compounding over your holding period.
That illustration is not a forecast. It assumes a fixed rate of return that almost never occurs, so treat it as a fee calculator rather than a return promise.
Fee levels are worth putting in context. A broad index fund commonly charges a fraction of a percent annually, often in the low tenths of a percent, while specialized, leveraged or fund-of-funds products can charge several times that. Comparing a plain index tracker against a strategy that does far more work with the same headline label is not a fair comparison, and the prospectus fee table is where you find out.
4. Understand Performance and Benchmark Information
The average annual total return table shows what a dollar invested at the start of each period would be worth at the end, net of fees, alongside a benchmark column. Read the column headings before the numbers, because the headings decide what the numbers mean.
Four things decide whether a performance table informs you:
- The start date. A fund with a short history covers a narrow window, sometimes a single unusually strong or weak stretch. Ten-year records carry more weight than one-year records.
- The end date. Tables are only updated as of a stated date. A table dated more than a year ago is not describing the current market.
- The benchmark. The benchmark column tells you whether the fund did its actual job, which for an index tracker is staying close to the index rather than beating it.
- Market price versus net asset value. ETF performance is reported both ways. Net asset value is the fund’s per-share value; market price is what you actually paid. A wide gap between the two signals a liquidity problem.
Every performance table carries a warning that past performance does not predict future results. For a passive index fund, that warning matters less than it does elsewhere, because the fund is designed to keep buying the index regardless of conditions. For an active or structured-income fund, it is the whole caution.
Also look at tracking error for index funds, which measures how far the fund’s return has drifted from its index over time. Persistent drift means something is interfering with the strategy, whether that is fees, cash drag, sampling or trading costs.
5. Read the Risk Disclosures
Start with the principal risks summary near the front, which lists the risk categories in plain language. Then go to the detail section and read only the risks that apply to the strategy you are holding.
For most ETFs that list includes market risk, the risk that the underlying holdings can fall in value. Beyond that, the ones worth checking depend on the fund:
- Concentration risk for single-sector, single-theme or small-holding-count funds.
- Tracking error risk for index funds that may not replicate the index precisely.
- Liquidity risk for funds holding less liquid securities, where selling at a fair price may be hard.
- Currency risk for funds holding assets denominated in other currencies.
- Derivative and counterparty risk for funds using options, futures, swaps or equity-linked notes. Counterparty risk means the fund depends on an outside institution honoring its obligations.
- Leverage and daily reset risk for leveraged and inverse funds.
The label does not remove the risk of what is underneath it. A fund whose index sounds conservative can hold derivatives, and a fund described as income can take on exposure its marketing never mentions. This is also where a genuine tension with community advice shows up: Bogleheads posters often argue that skimming is enough because fees decide most outcomes over decades. That is largely right for a plain index fund and wrong for a derivative-heavy income fund. The prospectus is what tells you which kind of fund you actually hold.
6. Check Turnover, Tracking, and the Fund’s Operational Disclosures
Portfolio turnover shows how often the fund buys and sells within a year. High turnover generates realized gains, tax distributions for shareholders, and higher trading costs. For a fund paying itself from options premiums, high turnover is the business model rather than a warning sign.
Then look at the operational policies, which usually live in the Statement of Additional Information or the back of the statutory prospectus.
- Creation and redemption. The mechanism that lets large investors exchange a basket of securities for fund shares and back again. Authorized participants, usually broker-dealers, do this. It is why ETFs usually trade close to net asset value, and understanding it explains the premium and discount disclosure.
- Premium and discount to net asset value. Some investor-protection funds publish historical premium and discount and bid-ask spread data. A fund with a wide typical spread costs you money every time you trade, and that cost is invisible on a chart.
- Securities lending. Whether the fund may lend holdings, what collateral is required, and how the revenue is split. Lending income often flows into the fund’s expense offset, which flatters the fee comparison.
- Cash and collateral management, and any policies on using derivatives for cash management.
- Portfolio managers and adviser. Who runs the fund, since when, and how large the firm is. A team change is a reason to re-read the fund.
Any disclosure that points to another document is a signpost, not a dead end. Follow it until you find the policy that could change your decision, then stop.
Common Mistakes
These six errors show up repeatedly, and each has a simple fix.
Confusing a factsheet or fact sheet for a prospectus. A one-page marketing summary highlights what the issuer wants you to see. The prospectus is the legally required disclosure. Read the prospectus, then use the factsheet for current holdings and pricing.
Reading stale performance figures. A cached table from a year ago still looks authoritative. Always check the date of the table itself, not just the date on the cover page, and prefer a version at least a few months current.
Looking only at the expense ratio. A low headline fee can be offset by acquired fund fees, trading costs from high turnover, or a wide bid-ask spread. Read the total operating expenses line and the purchase and sale of fund shares section before concluding anything.
Treating the benchmark as a promise. A fund that tracks an index will aim to match that index, and it may not. Tracking error exists precisely because the fund holds cash, pays fees, trades at different times and may sample rather than fully replicate. The benchmark tells you the target, not the floor on your return.
Overlooking the portfolio because the name sounds safe. Index names describe an aim, not a guarantee of holdings. Check the actual holdings list and the strategy paragraph, especially for anything with income, dividend, thematic or smart in the name.
Assuming a cheap fee makes a fund safe. Cost and risk are separate axes. Fee affects your return; risk affects how much you can lose and how uncomfortable you will be holding it. A low-fee fund holding a narrow slice of one sector can be far riskier than a costlier diversified one.
Tips for Using an ETF Prospectus
A repeatable process beats a thorough read every time. This is the sequence I use when a new fund catches my eye.
- Open the summary prospectus from the issuer’s own documents page. Confirm the fund name and the filing date on the first screen.
- Read the objective and strategies in two minutes. If the fund is not doing what you want, stop here.
- Check the holdings on the issuer’s portfolio page and note sector weight, holding count and any cash position.
- Price the cost against two comparable funds using total annual fund operating expenses and the hypothetical return illustration.
- Read the principal risks that apply to the strategy, especially concentration, derivative and counterparty risk.
- Compare performance against a suitable benchmark over a period long enough to be meaningful, and note the as-of date.
- Check premium and discount history plus average daily volume before you trade a fund you do not already own.
Close reading is not optional in certain categories. It genuinely matters for covered-call and option-income funds, leveraged and inverse funds, single-sector and single-company funds, small and new funds, any fund that lends securities, and any fund whose marketing does not match your assumption about what it holds. Elsewhere, a careful skim is enough, and that is not laziness; it is proportional effort.
One honest word on cost. Bogleheads posters often point out that a 0.35% expense ratio is not cheap, and they are right that fees compound against you. The counter-argument they raise, that established and liquid issuers are usually worth a slightly higher fee, is also reasonable. Neither position replaces reading the fee table in the fund you are actually considering.
Remember what the prospectus is for. It tells you what a fund does, what it charges and what can go wrong. It does not tell you whether the fund suits your goals, tax situation or time horizon, and it is not a recommendation. That judgment is yours, and for anything significant, a registered financial adviser is the right person to have look at it with you.
Frequently Asked Questions
Do you actually need to read an ETF prospectus?
Yes, at least the summary prospectus. It takes about ten minutes and it is the only document legally required to state the fund’s objective, fees, principal risks and past performance. Read the statutory version closely before buying covered-call or income ETFs, leveraged or inverse funds, single-sector funds, or anything that lends securities.
How do I find an ETF prospectus online?
Go to the fund issuer’s own site and look under documents, then prospectus or legal. The same document is filed publicly with the SEC and searchable on EDGAR by fund name or ticker, under filings made by the registrant. Most brokerages also show a link to the current prospectus on the fund’s detail page, though it can be buried.
Should I read the summary prospectus or the full statutory one?
Read the summary first, always. If the fund is a plain index tracker with low fees and broad diversification, that is usually enough. Read the statutory version when the fund does something unusual, such as writing options, holding equity-linked notes, concentrating in one sector, using leverage, or lending securities. The operational detail lives in the Statement of Additional Information.
How long does an ETF prospectus take to read?
The summary takes about ten minutes. The statutory prospectus runs roughly 60 to 100 pages, but triage keeps the useful part to the fee table, the strategies paragraph, the principal risk summary, the performance table and the purchase and sale of fund shares section. That triage is a 20 to 25 minute job once you know what you are looking for.
How do I know my prospectus is the current version?
Check the date near the front of the document and compare it with the issuer’s documents page. SEC rules require prospectuses to be updated at least annually, and stale versions keep circulating on third-party sites and search results. If the filing date looks old or the issuer’s page shows a newer version, take the newer one.
What is tracking error and why does it matter in a prospectus?
Tracking error is how far an index fund’s return has drifted from its index over time, usually reported as a standard deviation. A fund that holds every constituent and few cash positions should track closely. Persistent drift signals that fees, cash drag, sampling or trading costs are interfering with the strategy, and it tells you the fund may not deliver the exposure you paid for.
Conclusion: Start With the Summary
Start with the summary prospectus and pull five facts: the investment objective, the total annual fund operating expenses, the principal risk summary, the performance table with its as-of date, and the current holdings. Then compare those five facts against a similar fund doing a similar job.
That is how to read an etf prospectus without wasting an afternoon. Ten minutes on the summary tells you whether the fund matches your goal, and twenty focused minutes on the fee, strategy and risk sections tells you whether the marketing matched the reality. Most funds are fine at that level. The ones that are not are exactly the ones worth the extra time.
The prospectus describes the fund. Whether it belongs in your portfolio is a separate judgment, and worth making with a professional when the amount involved is significant.