
A fund fact sheet is a short summary document, usually one to three pages, that shows a fund’s objective, strategy, holdings, fees, risk statistics and returns. Reading one properly takes about fifteen minutes if you work through it in a fixed order: name and date first, then objective, risk, costs, holdings, performance, manager, and tax treatment.
Most people get the order wrong. They open the PDF, look at the return table, find a number they like, and move on. That skips the three fields that actually decide whether the fund belongs in their account.
This guide walks through the whole document in nine steps, including the specific line items worth a beginner’s attention and the ones that are noise. It applies to US mutual funds and ETFs. Funds in other countries use similar headings with different conventions attached, and the numbers do not always translate.
Table of Contents
- What You Need
- Step-by-Step: How to Read a Fund Fact Sheet
- 1. Confirm the fund’s name, type, and date
- 2. Read the investment objective and strategy
- 3. Understand the fund’s risk profile
- 4. Check fees and expenses
- 5. Examine holdings and diversification
- 6. Evaluate performance in context
- 7. Review manager information and portfolio turnover
- 8. Check distributions, taxes, and account considerations
- 9. Compare the fund with alternatives and decide
- Common Mistakes
- Frequently Asked Questions
- What is a fund fact sheet?
- Is a fund fact sheet the same as a prospectus?
- What is the most important number on a fund fact sheet?
- How many years of performance should I look at?
- Can I compare mutual fund and ETF fact sheets directly?
- Does a fact sheet tell me whether a fund is right for me?
- Conclusion
What You Need
Four things, and one of them matters more than the other three combined.
- The fact sheet itself. Every fund company publishes one on its own site, usually under a Documents or Fund Materials tab. Fund sponsors also file these documents with the SEC, so you can pull an official copy from EDGAR when a company site is hard to search.
- The prospectus or summary prospectus. The fact sheet is a summary. The prospectus is the legal document, and it carries the details the summary leaves out.
- The fund’s website or data page. This is where current net asset value, assets under management and daily pricing live. The fact sheet is a snapshot from a date that is already behind you.
- A spreadsheet or calculator. Fees are the one field where doing the arithmetic yourself changes your decision, and doing it in your head is hard.
Verify the figures against the fund’s official documents before acting on them. Funds change share classes, adjust fee schedules, swap managers and revise strategy language, and a fact sheet dated nine months ago may describe a product that no longer exists in the same form.
Step-by-Step: How to Read a Fund Fact Sheet
Work through these nine steps in order. Starting with the objective and structure keeps you from judging a fund on a return number produced under rules you have not understood yet.
1. Confirm the fund’s name, type, and date
The top of page one usually carries a full legal name that is longer than the name you have been calling it. Read it carefully, because many families run near-identical funds with different tickers and different share classes.
Next to the name sit four fields that determine what you are actually looking at:
- Share class. The same portfolio can be sold as Class A, Class I, Class R or an institutional class, each with a different fee structure. Two share classes of one fund are one investment, not two.
- Investment type. Mutual fund, exchange-traded fund, interval fund or collective investment trust. These have different liquidity, pricing and account rules.
- Inception date. The day the fund began. A fund started six months ago has no track record, whatever its chart suggests.
- Fact sheet date. Usually printed near the fund name or in the footer. Read every figure as “as of” this date, not as of today.
If the share class on your statement does not match the share class on the fact sheet, stop and find the right document. Comparing the wrong share class is the most common self-inflicted error in this whole process.
2. Read the investment objective and strategy
The objective is one or two sentences describing what the fund is trying to do, such as tracking a specific index or seeking long-term capital appreciation. Read it as a promise you can hold the fund to later.
Strategy is the mechanism. It tells you what the fund actually buys, how those holdings are selected and how often the portfolio is rebuilt. Some strategies are mechanical: an index fund holds every security in its benchmark in benchmark weights. Others are discretionary, where managers decide position by position.
Check four things against the stated objective:
- The benchmark index, named explicitly. A stated benchmark should match the strategy in plain language.
- Asset classes, including how much sits in cash or short-term instruments. A fund calling itself a stock fund can still hold 8 percent cash.
- Geographic focus, which can be US-only, regional, emerging markets or global.
- Any restrictions, such as a cap on single-position size or a limit on lower-rated credit.
A mismatch here is the first real red flag. A fund whose stated approach is defensive but whose holdings are concentrated in a handful of speculative names is not doing what the page claims.
3. Understand the fund’s risk profile
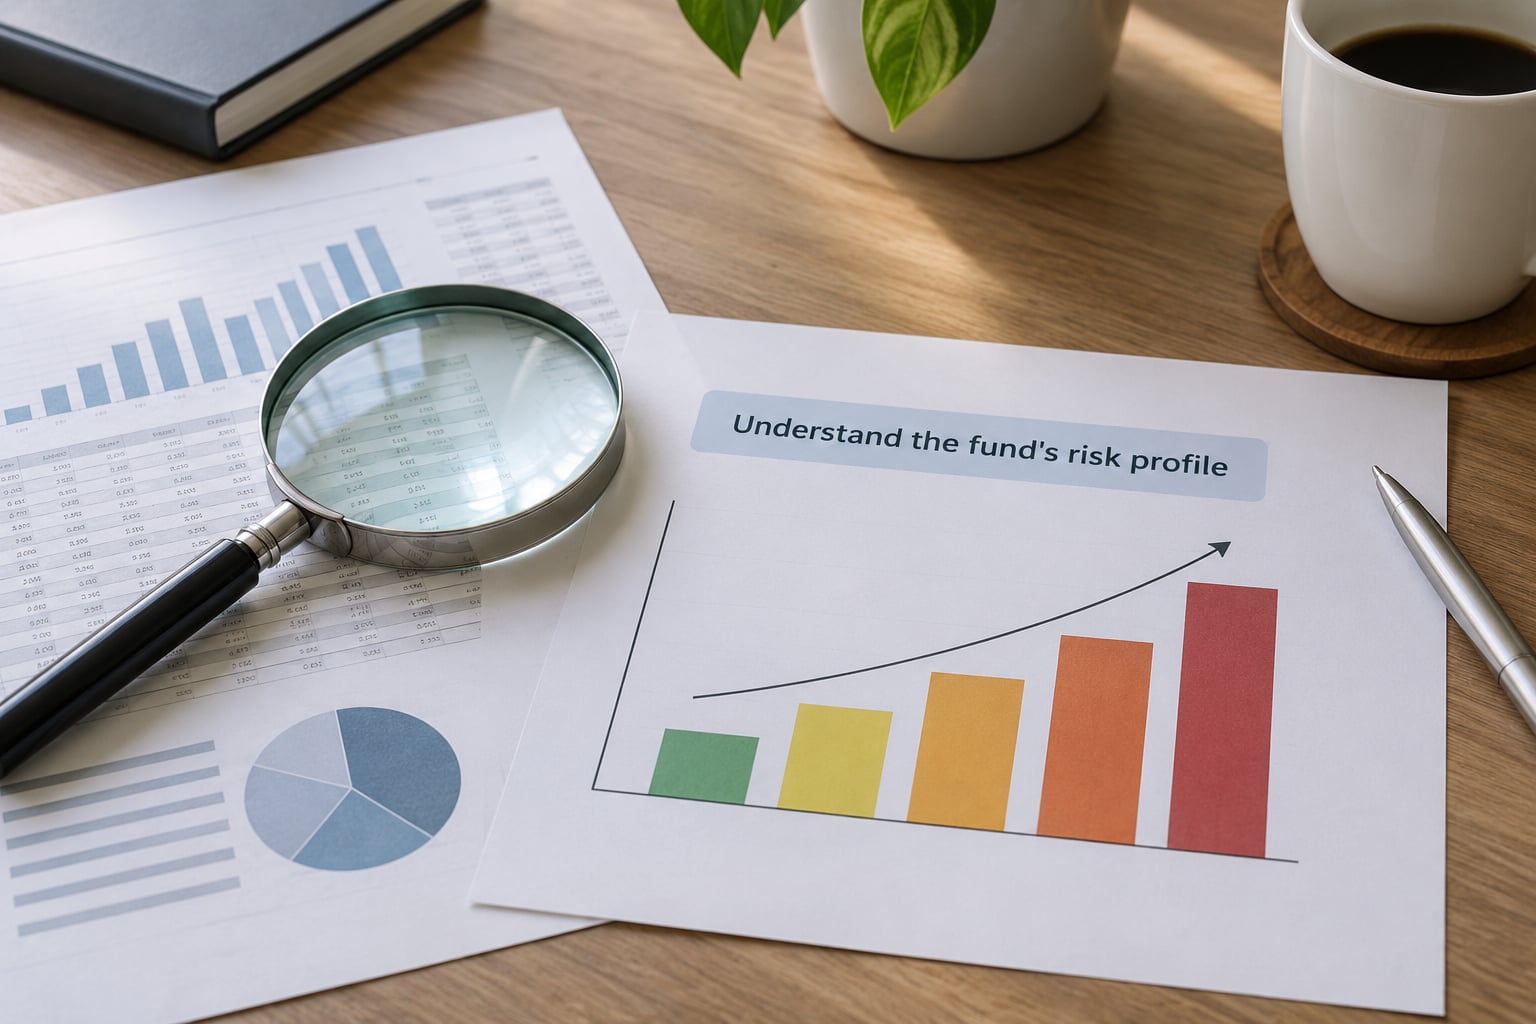
The risk section comes in two forms. The first is narrative, describing the principal risks the fund expects to face: market risk, credit risk, interest rate risk, liquidity risk, currency risk for funds holding foreign assets, and concentration risk where the portfolio is narrow.
The second is statistical, usually a small table with three numbers. Each one measures how much the fund’s returns have bounced around, and all three are backward-looking:
- Standard deviation measures how far returns have moved from their average over a set period. Higher means more bumpy.
- Sharpe ratio divides excess return above a cash benchmark by that volatility, so it rewards return that came with steadiness. A rough reading is that above 1 is decent, above 2 is strong for most categories.
- Beta measures sensitivity to the overall equity market. A beta near 1 moves with the market, above 1 amplifies it, below 1 dampens it.
Compare these numbers against funds in the same category, never across categories. An active emerging-markets fund will post a higher standard deviation than a short-term bond fund, and that fact tells you nothing about manager skill.
A stated risk rating is a label, not a promise. A document can describe a fund as moderate risk and still lose a third of its value in a quarter, which happened across several equity categories in recent years.
4. Check fees and expenses
Cost is the field experienced readers dig into hardest, and for good reason. It is the only figure on the page that is fully knowable in advance and the only one that reliably drags on returns every single year.
Read these lines separately, because they behave differently:
- Expense ratio or management fee. The stated annual percentage taken from fund assets, covering most operating costs. It is already inside the reported performance, so no double subtraction is needed.
- Share class or fee differential. Often shown as “net expense ratio” plus “waiver” or “contractual expense.” Large retail share classes of index funds frequently carry a waiver that expires on a set date, and when it lapses the cost steps up.
- Load. A sales charge, usually taken at purchase in the US. Redemption fees on some fund types also appear here and are deducted when you sell.
- 12b-1 fees. Ongoing marketing and distribution costs, folded into the expense ratio rather than billed separately.
- Other fund expenses. Acquired fund fees and charges when the fund buys other funds, which compound with the underlying expense ratios.
The compounding is what makes a small percentage serious. A 1 percent annual fee over a 30-year holding period takes roughly a quarter of the final balance compared with an identical fund costing 0.25 percent, before any return is earned on the difference.
One caution on a low number: a tiny expense ratio on an active fund sometimes means the manager is running a concentrated book of his own stock picks. Cheap in percentage terms does not mean cheap in risk terms.
5. Examine holdings and diversification
The holdings section is where a stated strategy either holds up or does not. Start with the top 10 positions, which are usually listed with weights as of the quarter-end date.
Add the ten weights together and read the result as a concentration percentage. If the top 10 make up a large share of a fund described as broadly diversified, you are looking at a concentrated portfolio no matter what the label says.
Then look at:
- Sector or industry allocation, compared with the benchmark. A meaningful overweight in one sector is a deliberate bet.
- Country weights, for funds investing outside the US.
- Cash and short-term holdings, which drag on returns in a rising market and cushion declines.
- Derivatives or leverage, which usually appear as a swap, futures or currency exposure line.
The check beginners skip is overlap. If you already own a broad index fund and the candidate fund holds the same large names, you have bought the same stocks twice and paid another fee for the privilege. Pull your existing holdings and compare names before you add anything.
6. Evaluate performance in context
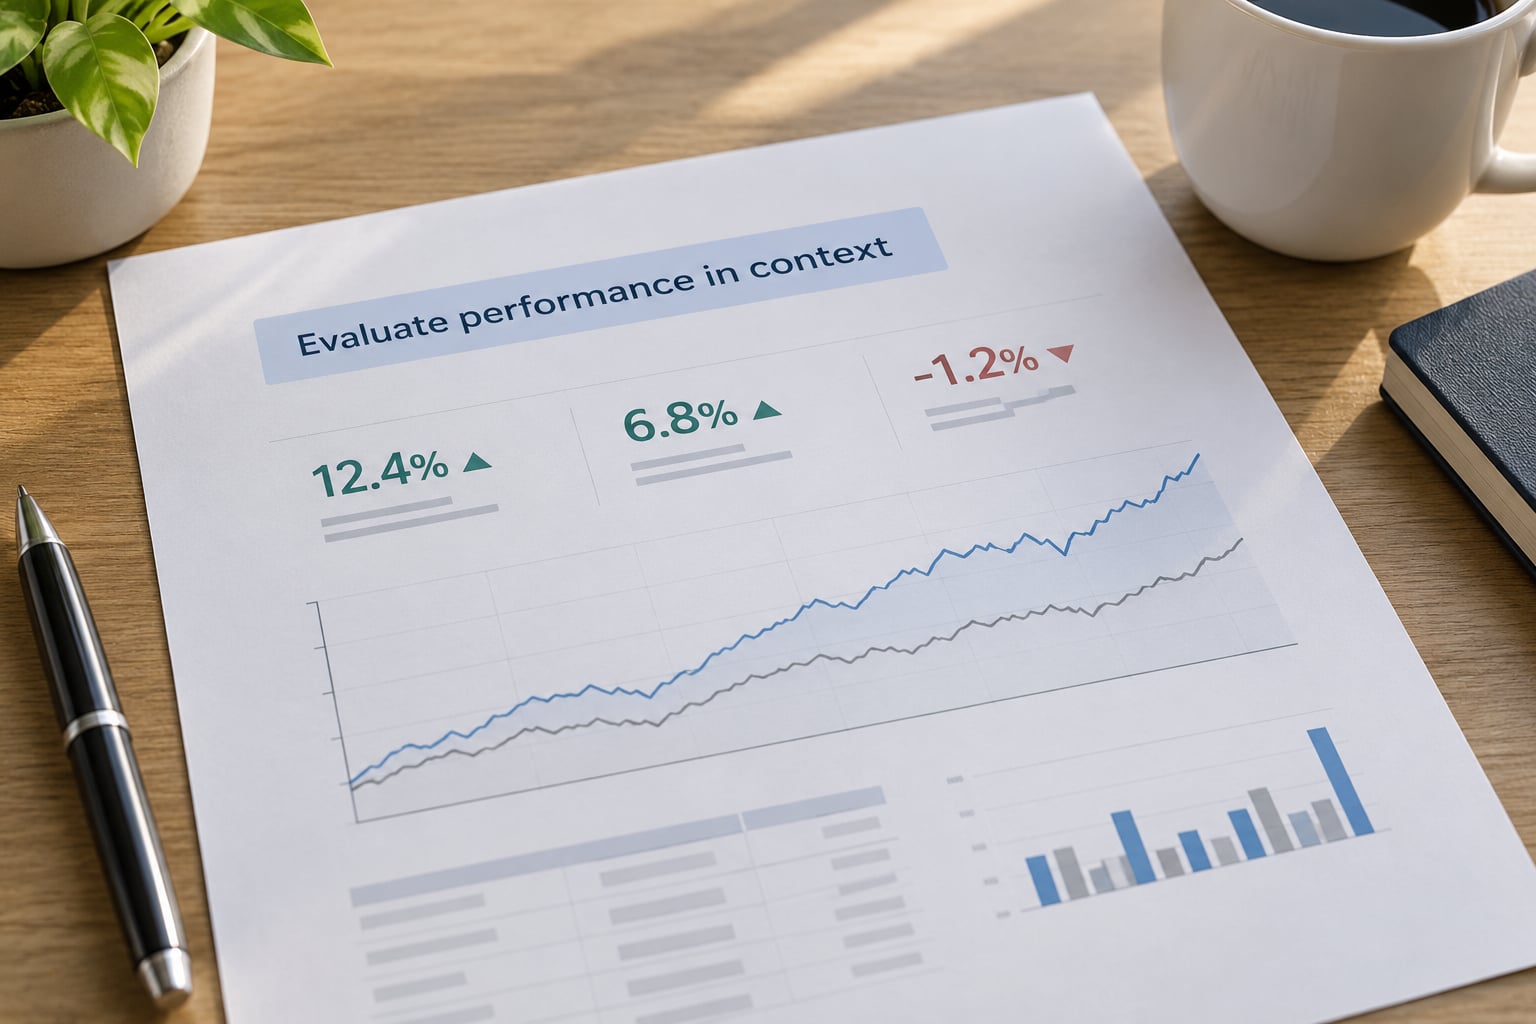
The performance table shows returns across several periods, usually one month, three months, year to date, one year, three years, five years and since inception. The percentages are almost always annualized for periods longer than one year, so a 12 percent five-year figure means roughly 12 percent per year compounded, not 12 percent total.
Three distinctions matter here:
- Total return versus price return. Total return assumes dividends and distributions were reinvested. Price return ignores them. A fact sheet’s headline table uses total return, and comparing it against a price-only index understates the fund.
- Calendar-year returns versus trailing returns. The calendar table lets you see which years were good and how many were bad. Trailing periods smooth that away and can flatter a fund that recovered from one bad stretch.
- Fund versus benchmark versus category. The fund’s own return matters far less than the gap to its benchmark and to its peer group. An active fund that trails its benchmark every year is charging you for the privilege.
The growth of a hypothetical 10,000 dollar investment chart answers the same question visually. It ends at the same place as the annualized return over the same period, but it makes the shape of the ride visible, including how much of the gain arrived late in a recovering market.
Past performance does not predict future results. Every fact sheet says so in language designed to be skimmed past, and it is the most accurate line on the page.
7. Review manager information and portfolio turnover
The management block names the adviser, the portfolio manager or managers, and often their start dates. Tenure is the field to read, not total years of experience, because the question is whether this person has been running this fund through the cycle you would be buying into.
Read the commentary too, with skepticism. Managers explain recent periods rather than the strategy, and the confident tone of a paragraph about a strong quarter tells you nothing about the next decade.
Portfolio turnover appears as a percentage and shows how much of the portfolio was replaced in a year. Index funds generally run low, often under 20 percent, since they rebalance mechanically. Active funds commonly exceed 100 percent, meaning the holdings turned over more than once.
High turnover is not automatically a problem, and it is not automatically fine. What it does is raise the cost, tax and complexity burden, so an active fund with high turnover needs its excess return over the index to justify it.
If the fact sheet covers management thinly, the prospectus and the fund’s regulatory filings hold the fuller detail on the adviser’s background and ownership.
8. Check distributions, taxes, and account considerations
Funds that pay out report distribution yield, plus the schedule of past distributions. A distribution is not extra money handed to you; it is paid out of assets you already own, and the net asset value drops by the same amount on the date it is paid.
Distributions usually arrive in two forms, and the split shows up in year-end tax reporting:
- Income distributions come from dividends and interest the fund collected.
- Capital gain distributions come from securities the fund sold at a profit, whether or not you sold anything yourself.
- Return of capital is sometimes reported separately. It returns part of your own original investment rather than being earnings, and it reduces your cost basis instead of being taxed as income.
Tax treatment depends on the account holding the fund, the character of the distributions, your own circumstances, and the rules in force at the time. Taxable accounts, traditional IRAs and Roth IRAs treat these differently. Rates and thresholds change, so confirm current treatment for your situation before relying on it.
Finally, check the minimum investment. A share class with the lowest fee often requires a large initial balance, which sometimes puts it outside reach of a retirement plan or a small account.
9. Compare the fund with alternatives and decide
A fund that looks fine alone can still be wrong for you. Score every candidate on the same seven points so the comparison is honest:
- Objective and benchmark match the job you need it to do.
- Expense ratio, compared against the category average.
- Risk level, measured against how much a drawdown you could actually sit through.
- Holdings overlap with what you already own.
- Performance versus benchmark and peers across five years and since inception.
- Minimum investment and whether it fits your account type.
- Tax treatment for the account it will live in.
Put the candidates side by side in a spreadsheet, one column per fund and one row per point above. Same-format columns remove the advantage that polished presentation gives a marketing-heavy fund.
If the fund still looks reasonable after that, read the prospectus for the full details on risks, fee waivers and portfolio managers. For your specific situation, a qualified financial professional can weigh details a one-page document cannot, such as your tax bracket, employer plan rules and time horizon.
Common Mistakes
These come up repeatedly, and each has a straightforward fix.
Treating yield as return. A distribution yield of 4 percent is an income figure, not a return. A bond fund yielding 4 percent can easily lose money on price if interest rates rise. Look at total return, which includes the change in value.
Comparing different share classes. The same portfolio in two share classes is one fund with two fee schedules. Comparing a no-load retail class against an institutional class makes the cheap one look like a different product entirely.
Comparing different time periods. A five-year annualized return and a three-month annualized return are not comparable, and neither is comparable to a raw year-to-date figure.
Relying on a single strong year. Calendar tables exist for a reason. A fund up 30 percent in one year and down 15 percent in each of the two before it is a different proposition from a fund up 8 percent three years running.
Ignoring turnover and concentration. Both appear as small percentages that most readers skip. Combined with a fee, they explain more of the gap to the index than manager skill ever will.
Making the decision from a fact sheet alone. It is a marketing-adjacent summary produced by the fund company. It is the right starting point and the wrong stopping point.
Using third-party screeners as the only source. Independent databases are useful for peer comparison and they can display figures for a different share class or a different date than the one on your statement. Reconcile the two before you act, and treat the fund company’s own document as the source of record.
A few habits keep the process fast. Read the fee section before the returns table, so a tempting number cannot colour your read of the costs. Check the fact sheet date every time. And save a copy of the one-page summary you settle on, so at next year’s review you can compare rather than re-research.
Frequently Asked Questions
What is a fund fact sheet?
A fund fact sheet is a short summary document, usually one to three pages, published by a fund company. It covers the fund’s objective, strategy, benchmark, top holdings, fees, risk statistics, historical performance and portfolio manager. Funds refresh it monthly or quarterly, so it is a snapshot of a past date rather than a live view of the fund.
Is a fund fact sheet the same as a prospectus?
No. The fact sheet is a summary written for investors; the prospectus is the legal offering document with the binding details on risks, fee waivers, share classes and account requirements. The summary prospectus sits between them, giving the legally required highlights in a shorter format. Use the fact sheet to screen, then read the prospectus before you invest.
What is the most important number on a fund fact sheet?
For most people the expense ratio wins, because it is the one cost you know in advance and it is charged every year in every market. It is also the easiest field to verify and compare across funds in the same category. Return figures attract attention, but they describe the past and ignore what the fund keeps out of your account along the way.
How many years of performance should I look at?
Use five years as a minimum, because it usually spans a full market cycle, and add the since-inception figure when the fund is at least ten years old. Shorter windows flatter funds that launched into favourable markets. Read the calendar-year table alongside the trailing numbers so you can see how many of those years were negative rather than only the ending value.
Can I compare mutual fund and ETF fact sheets directly?
Only with care, because the two formats price and disclose differently. An ETF has a live market price, a bid-ask spread and a brokerage commission per trade, while a mutual fund prices once at the close and typically no-load. ETFs also disclose holdings more frequently than mutual funds. Compare the underlying portfolio, strategy, expense ratio and index rather than the wrapper.
Does a fact sheet tell me whether a fund is right for me?
No document can. A fact sheet describes the fund; it knows nothing about your time horizon, tax situation, employer plan rules or tolerance for a large temporary loss. Use it to narrow a list to two or three candidates, then judge those against your own circumstances. A qualified financial professional can help with the second half of that decision.
Conclusion
Start with the fund’s objective, confirm the share class and the fact sheet date, then read fees, risk, holdings and performance against your own goals and against the alternatives. Fifteen minutes in that order will tell you more than an hour of scrolling return tables.
Nothing here is individual financial advice, and fund terms, tax rules and fee structures change. Verify the details in the fund’s official documents, and bring your specific situation to a qualified professional before you commit money.