
The Morningstar Style Box explained in one line: it is a three-by-three grid that sorts stocks, mutual funds and ETFs into nine categories using two inputs, the average market value of what a fund owns and whether that portfolio is priced like a growth holding or a value holding. Morningstar built the grid in 1992, and reading it takes about ten seconds once you know which axis to look at first.
The part that trips people up is not the idea, it is the layout. A Morningstar fund profile page also shows a risk rating, a star rating and a long list of performance numbers, so the little tic-tac-toe grid gets lost in the noise. Get the two axes straight and the box becomes the fastest way to see whether four funds in your account are really four different bets or one bet wearing four different names.
Table of Contents
- Morningstar Style Box Explained: What Each Number Means
- How Morningstar Calculates the Style Box
- How to Read the Nine Style Categories
- How to read the box on a fund profile page, step by step
- What Is the Difference Between Growth, Blend, and Value?
- Why the Fund’s Size Category Matters
- What the Style Box Does Not Tell You
- The style box is not the Morningstar Rating
- Style drift: why your fund changes boxes
- How to Use the Style Box When Comparing Funds
- Frequently Asked Questions
- How do I read a Morningstar Style Box?
- What does the Morningstar fixed-income style box mean?
- Is the style box the same as the Morningstar Rating?
- Why did my fund change its style box category?
- What is the difference between core and blend?
- Does the style box tell me which fund is better?
- Start With the Style Box, Then Check the Details
Morningstar Style Box Explained: What Each Number Means
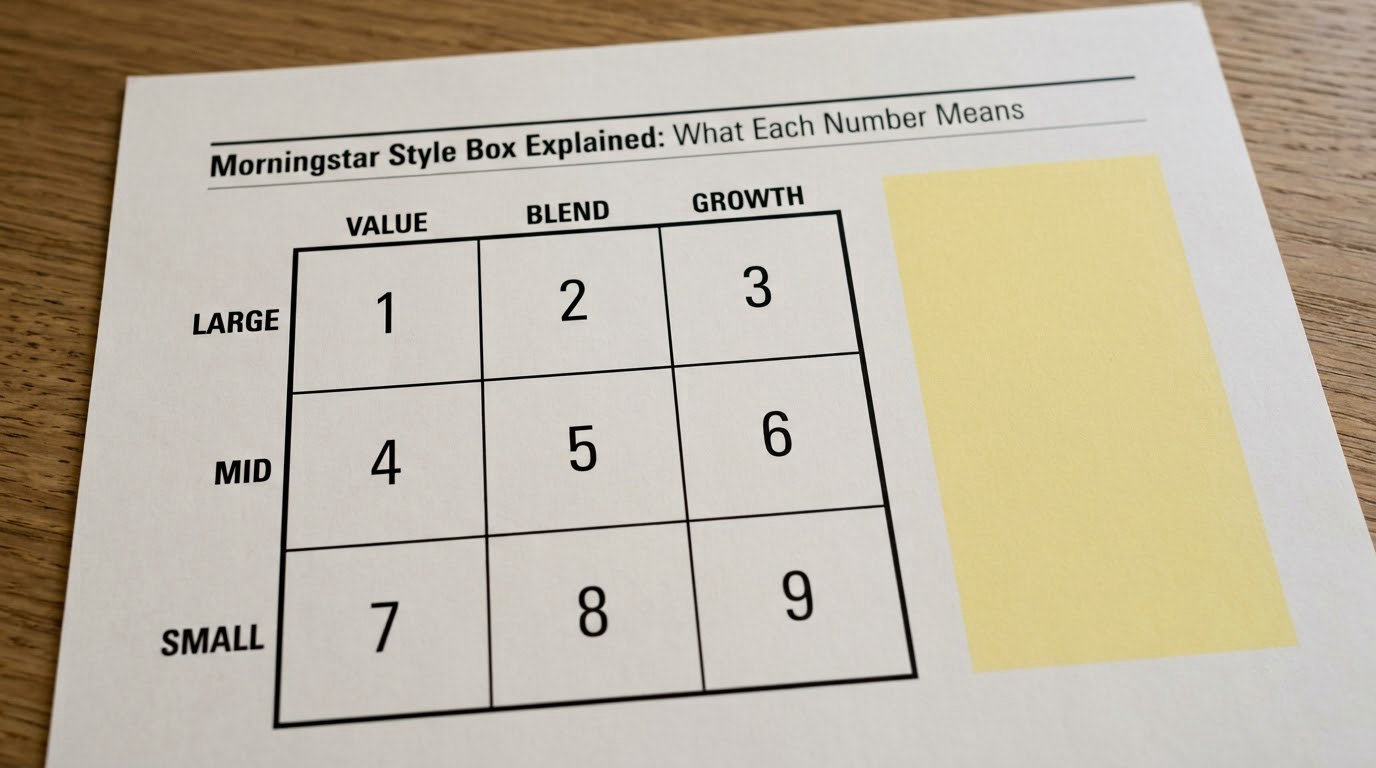
Every cell in the grid answers two questions at once. The row tells you the typical size of the companies inside the portfolio, and the column tells you how those companies are priced relative to what the market pays for similar businesses.
Rows run large at the top, mid in the middle, small at the bottom. Columns run value on the left, blend in the middle and growth on the right. That is the whole mechanic, and it is why the grid looks the same on every stock, every fund and every ETF profile you will ever open.
| What the axis is | What it measures | Positions, left to right or top to bottom |
|---|---|---|
| Vertical axis (rows) | Median market value of the holdings, derived from shares outstanding multiplied by share price | Large, mid, small |
| Horizontal axis (columns) | Morningstar’s value-versus-growth score, built mainly from median price-to-earnings and price-to-book ratios | Value, blend, growth |
One detail worth knowing early, because it is the source of most online arguments: the middle column is called core when Morningstar is classifying individual stocks and blend when it is classifying funds. Same middle cell, different word, different object.
How Morningstar Calculates the Style Box
Classification runs on the actual holdings, not on the fund’s name or its stated objective. That distinction matters more than it sounds, because a lot of funds carry marketing words in their ticker and legal name that have nothing to do with how they are built.
Size is decided by market capitalization. Market cap is simply shares outstanding multiplied by the current share price, and Morningstar looks at the median across the portfolio. The old shorthand for the bands is that the largest roughly 250 stocks count as large cap, the next 750 as mid cap and everything after that as small cap. In dollar terms the commonly quoted thresholds run from about 10 billion dollars of market value at the large end, 2 to 10 billion dollars in the mid band, and under roughly 2 billion dollars for small.
Those dollar bands are not hard walls. Market values move every day, so a company sitting near a boundary can land in a different row without the fund changing a single share, and Morningstar reclassifies funds on its own schedule as holdings shift.
Column is decided by valuation. Morningstar builds a value-versus-growth score for the portfolio that blends several characteristics, including the median price-to-earnings ratio, the median price-to-book ratio and how each stock’s price has moved relative to where it has traded over the past year.
The ratios are easy to grasp once you see one. A share price of 20 dollars against 2 dollars of earnings per share gives a price-to-earnings ratio of 10. Share price of 20 dollars against 5 dollars of earnings per share gives 4. The second company is three times as expensive on earnings, which is the kind of gap the middle column exists to measure.
Price-to-book works the same way with book value. And there is a catch readers rarely hear stated plainly: a low multiple is not automatically a bargain. If a business is cheap because margins are collapsing or management has burned cash for a decade, the low ratio is a warning, not a discount.
How to Read the Nine Style Categories
Read the grid like a map. One finger on the row you care about, one finger on the column, and the cell between them is your fund.
| Size and style | What the portfolio typically holds | Relative risk |
|---|---|---|
| Large growth | Big companies whose share prices are rich on earnings and book value, often spending heavily on growth | Highest of the nine |
| Large blend | Big companies held in a mix of growth-priced and value-priced names | High |
| Large value | Big companies trading at low multiples on earnings and book value | Moderately high |
| Mid growth | Mid-sized companies priced on optimism about future earnings | High |
| Mid blend | Mid-sized companies held in a mixed growth and value mix | Moderately high |
| Mid value | Mid-sized companies with low earnings and book multiples | Moderate |
| Small growth | Small companies priced for fast expansion | High to very high |
| Small blend | Small companies held in a mixed growth and value mix | High |
| Small value | Small companies with low multiples and thin margins | Highest of the nine |
Risk generally rises as you move right and as you move down. Growth-priced portfolios carry more of their weight in future expectations, which is why they swing harder when interest rates or sentiment shift, and small companies have far less room to absorb a bad quarter than large ones. Treat the ordering as a tendency, not a promise about any given year.
How to read the box on a fund profile page, step by step
- Open the fund’s profile and find the grid. It sits near the top on Morningstar, and it appears on most third-party fund pages too.
- Read the highlighted cell for the row first. That tells you the typical size of the companies being owned.
- Read the column next. That tells you how the portfolio is priced.
- Check whether the fund sits near a cell border. Funds sitting near a dividing line are the ones most likely to change boxes.
- Open the holdings and confirm. The top ten positions should look consistent with the cell you just read.
What Is the Difference Between Growth, Blend, and Value?
The columns describe how a portfolio is priced right now, not what it promises to do next.
- Value portfolios hold companies with low price-to-earnings and price-to-book ratios. Investors are buying current earnings, existing assets or cash on hand at a discount to what the market seems to think they are worth.
- Growth portfolios hold companies with high multiples. The price assumes profits grow faster than the market, so the position rests on future earnings rather than today’s.
- Blend portfolios hold both, usually because the manager does not force a bet. For individual stocks Morningstar calls the same middle category core.
Small differences in multiples over a full cycle tend to wash out, and a low multiple can just as easily mark a company in trouble as a bargain. The label is a description of the current portfolio, not a forecast.
Why the Fund’s Size Category Matters
The row tells you how the underlying businesses behave, independent of the column. Large companies are usually established, cash-generative and slow to change, and they tend to move with broad market swings rather than against them. Mid companies sit in the middle on revenue scale and on how often the market changes its mind about them.
Small companies have the least cushion. A single weak quarter, a lost customer or a higher cost of debt can hit the whole business, which is why small-cap categories carry more volatility than their large-cap counterparts and why most people size them smaller in a portfolio.
Size also sets the comparison group. When Morningstar ranks funds, it does it inside a category, so a large blend fund is only ever measured against other large blend funds. Comparing a large blend fund to a small growth fund tells you almost nothing about manager skill, because the two portfolios were never competing on the same terrain.
What the Style Box Does Not Tell You
The box is one measurement built from two data points. Here is everything it leaves out.
- Sector and region concentration. Two funds in the same cell can hold completely different industries, and a fund with one dominant sector is not diversified just because it sits in the middle square.
- Individual holdings. The box says nothing about whether the largest positions are well chosen.
- Cost. Expense ratios are separate, and two identical style categories can differ widely in what they charge you.
- Manager skill and portfolio turnover. Both matter to results and neither appears in the grid.
- International funds. A global equity fund is assessed with a separate version of the box that accounts for its geographic mix.
- Long-short strategies. Because the box is built on what a fund owns, a strategy built partly on short positions cannot be represented in it at all.
The style box is not the Morningstar Rating
People mix these up constantly, and the two have nothing to do with each other. The Morningstar Rating is the star ranking, and it measures how a fund performed against its category peers and its risk level over a set number of years. The style box measures only the size and valuation profile of the holdings. A one-star fund can be large growth, and a five-star fund can be large value.
| Measure | Question it answers | Uses past performance |
|---|---|---|
| Style box | What kind of companies does this fund own and how are they priced? | No |
| Morningstar Rating | How did this fund do against its peers, adjusted for risk? | Yes |
| Risk rating | How much did returns vary, and how sharply did the fund fall? | Yes |
Style drift: why your fund changes boxes
A fund gets reclassified for ordinary reasons. Its holdings appreciated or fell, pushing the median market cap into a different row. New positions pushed the median earnings and book ratios across a column boundary. Or the portfolio simply changed, because new money arrived, managers sold names, or a merger reshaped the fund.
A box change is not a scandal and it carries no penalty by itself. What matters is whether it matches the fund you actually hold today. Check the fund’s category history before you buy, and look at the current top holdings rather than the label you remember from two years ago. If a fund you chose for small-cap value now sits in large blend, the name and the mandate no longer describe the risk you are taking.
How to Use the Style Box When Comparing Funds
Once you can read the grid, use it as a filter rather than a verdict.
- Check the cells of the funds you already own. Several large blend funds are not diversification, they are the same bet repeated, and the grid shows that in seconds.
- Compare only inside a category. Fund rankings and risk figures are built within style categories, so that is the only comparison that is like for like.
- Read the valuation data behind the cell. The median price-to-earnings and price-to-book ratios tell you how aggressive the positioning really is, which a cell name alone does not.
- Add the things the box ignores. Cost, sector mix, holdings turnover and manager tenure belong in the same conversation as the style label.
- Decide how many cells you want to hold. Plenty of investors keep one or two core funds and let the grid guide the rest. Owning all nine cells deliberately is defensible, but it is more work to maintain than most people expect.
Style-box ETFs exist for people who want a single-ticket way to tilt toward one cell, and they are a straightforward way to express a view on size or style. Whether one belongs in your core depends on your diversification plan, not on the label.
Frequently Asked Questions
How do I read a Morningstar Style Box?
Find the highlighted cell and read it in two moves. The row gives the typical size of the companies a fund owns, running large, mid and small from top to bottom. The column gives how that portfolio is priced, running value, blend and growth from left to right. The cell where the two meet is the fund’s style category.
What does the Morningstar fixed-income style box mean?
Bond funds are classified on a different pair of axes. One axis is credit quality, based on the asset-weighted average credit rating of the holdings and run from high quality at the top to low at the bottom. The other is interest-rate sensitivity, measured by effective duration: limited, moderate or extensive. That box tells you about credit risk and rate risk, not company size or valuation.
Is the style box the same as the Morningstar Rating?
No, and this is the most common mix-up. The Morningstar Rating is the star ranking, which looks at past performance against category peers, adjusted for risk. The style box looks only at the size and valuation profile of current holdings, so a low-rated fund can be large growth and a highly rated fund can be large value. Use them separately.
Why did my fund change its style box category?
Usually nothing dramatic happened. Holdings rose or fell in value and pushed the median market cap into another row, or the median earnings and book ratios crossed a column boundary. New money, manager changes and mergers can do it too. A reclassification is not a penalty. What matters is whether the current category still matches what you bought the fund for.
What is the difference between core and blend?
It depends on what Morningstar is classifying. For individual stocks, the middle column is called core and describes a stock that neither looks clearly growth-priced nor clearly value-priced. For funds, the middle column is called blend and describes a portfolio that holds a mix of growth and value stocks. Same middle position, different word, different object being described.
Does the style box tell me which fund is better?
No. It is a classification, not a recommendation or a performance ranking. It tells you what a fund owns, which is genuinely useful for spotting hidden overlap in your portfolio and for comparing funds on a like-for-like basis. Choosing between funds still comes down to cost, holdings, manager and risk, none of which appear in the grid.
Start With the Style Box, Then Check the Details
Read the cell, confirm it against the current holdings, and then move on to cost, sector mix and manager tenure. The grid is a fast way to know what you are actually buying, and in 2026 that is still the cheapest research you can do in under a minute.
This is a general explanation of how a classification method works. Fund details and market conditions change, and it is worth checking the current methodology and your own circumstances before acting.