A stock quote is a snapshot of a stock’s price and trading activity on an exchange at one moment in time. To read one, work through it in a fixed order: identify the ticker and exchange, then the last price and change, then the bid, ask and spread, then the day’s and 52-week ranges, then volume, and only then the size and valuation fields sitting on the same screen.
That order takes about two minutes once you have done it a few times, and it prevents the mistake almost every beginner makes, which is staring at the big green or red number and deciding something from it.
Worth saying up front: a quote is a trading record, not a verdict on a company. It tells you what the last completed trade looked like, what buyers and sellers are quoting right now, and how busy the stock has been. Whether the business is worth owning is a separate question that lives in financial statements.
Table of Contents
- What You Need Before You Read a Stock Quote
- Where the data comes from
- Every field on the screen, in one table
- Step-by-Step: How to Read a Stock Quote Field by Field
- Start with the ticker, company name, and exchange
- Read the last price, change, and percent change in a stock quote
- Compare the open, previous close, day range, and 52-week range
- Check bid, ask, and volume
- Interpret dividend, yield, and other quote statistics
- Common Mistakes When Reading a Stock Quote
- Tips for Using Stock Quotes Wisely
- Frequently Asked Questions
- How do I read a stock quote as a beginner?
- How do I know the actual price of a stock?
- What is the bid-ask spread and why does it matter?
- Are free stock quotes real time or delayed?
- Is it better to buy a stock with high volume or low volume?
- What does the 52-week range mean on a stock quote?
- Conclusion
What You Need Before You Read a Stock Quote
You need very little. A quote source, the ticker symbol of the company, and a clear idea of which trading session the numbers belong to will carry you through everything on the screen.
Where the data comes from
Every quote you see is exchange-reported data passed through one or more intermediaries. The exchange matches orders, the network that carries those trades to brokers charges a fee, and your broker or website republishes what it receives. Free feeds are commonly 15 minutes delayed, which is why a price on a general finance site can differ from the price in your brokerage app.
Trading moved to decimal pricing in 2001, a change the SEC pushed partly because fractional quotes widened the spread on cheap stocks. It is still the reason spreads on liquid large caps are now measured in pennies rather than fractions of a point.
Every field on the screen, in one table
Layouts differ between a broker app, a desktop site and a general finance page, so the fields will not sit in the same places. The names do not change, though, and this table covers what nearly every US quote page shows.
| Field | What it means | Why it matters |
|---|---|---|
| Company name | The registered name of the issuer. | Confirms you are looking at the business you think you are. |
| Ticker symbol | The short exchange code for the security, such as AAPL or KO. | The only reliable identifier. Company names get reused, tickers rarely are. |
| Exchange | NYSE, Nasdaq or an over-the-counter venue. | Different venues carry different disclosure and liquidity standards. |
| Last price | The price of the most recent completed trade. | Historical fact, not a quote to anyone. |
| Bid | The highest price a buyer is currently offering. | The price you roughly receive when you sell right now. |
| Ask | The lowest price a seller is currently accepting. | The price you roughly pay when you buy right now. |
| Bid-ask spread | Ask minus bid. | A real cost of trading, and a quick read on how liquid the stock is. |
| Change | Last price minus the previous close, in dollars. | Shows the day’s move in absolute terms. |
| Percent change | Change divided by the previous close. | Makes moves comparable across price levels. Meaningless without context. |
| Previous close | Last price of the prior regular session. | The baseline every daily change is measured against. |
| Open | The first trade price of the session. | A large gap from the previous close signals overnight news. |
| Day’s range | The session low and high. | Shows how far price travelled, which is your volatility gauge. |
| 52-week range | The lowest and highest price over the past year. | Puts today’s price in the context of a full cycle. |
| Volume | Shares traded so far today. | Measures participation. Intraday, it is always partial. |
| Average volume | The typical daily share count, usually a 3-month mean. | The baseline that tells you whether today’s volume is unusual. |
| Market cap | Share price multiplied by shares outstanding. | Company size in one number. Says nothing about value. |
| Shares outstanding | All shares in issue, including those held by insiders. | The multiplier behind market cap. |
| Float | Shares actually available to trade publicly. | A small float beside heavy volume means prices move fast. |
| P/E ratio (TTM) | Price divided by trailing twelve months of earnings per share. | A valuation comparison tool, sensitive to whether earnings are growing. |
| EPS | Net income divided by shares outstanding, per share. | <tdThe earnings number the P/E is built on.|
| Beta | How far the stock has moved with the broader market, usually over three years. | Relative sensitivity, not a measure of the chance you lose money. |
| Dividend and yield | The annual payout per share and that payout as a percentage of price. | Income component. Yield is calculated on price, so it moves daily. |
| Ex-dividend date | The date the stock trades without the upcoming dividend. | Buying the day before does not hand you the payment. |
| Earnings date | The scheduled or estimated next report date. | Single largest source of a scheduled price gap. |
Step-by-Step: How to Read a Stock Quote Field by Field
Start with the ticker, company name, and exchange
Open with identity, not price. A quote page can hold several securities under one company name: common shares, preferred shares, warrants, depositary receipts and different share classes. Meta Platforms, for instance, has two listed classes of common stock and they trade at noticeably different prices.
The exchange tag tells you more than the ticker does. NYSE and Nasdaq listings follow US disclosure rules and minimum listing standards. An over-the-counter quote looks similar on screen but sits under lighter reporting requirements, which is why far fewer OTC names have an earnings calendar or a research target.
One more check before anything else: currency. US listings price in dollars, and the same company listed in London, Toronto or Frankfurt on the same feed can appear in pounds, Canadian dollars or euros, sometimes with a decimal format that looks similar but is not.
Read the last price, change, and percent change in a stock quote
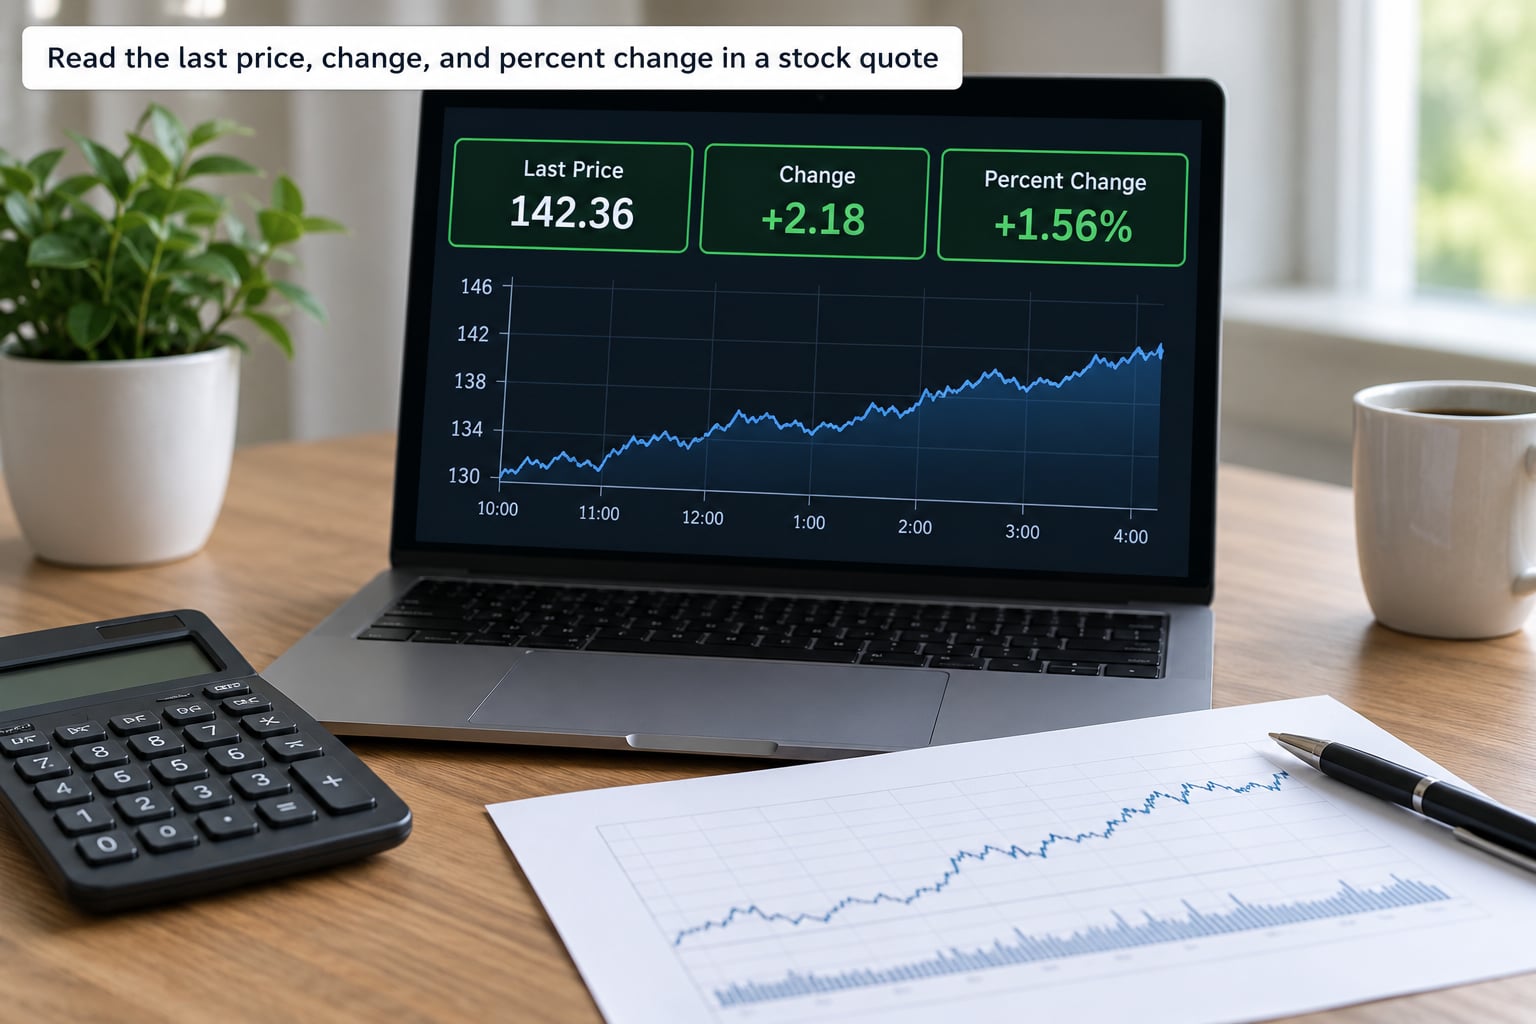
The last price is the price of the most recent completed trade. It has already happened. Once the second hand moves on, that trade is history, and the only live pricing on the screen is the bid and the ask.
Change and percent change compare that last price to the previous close. If a stock closed at 181.90 and the last trade was 184.62, the change is 2.72 and the percent change is about 1.5 percent, because 2.72 divided by 181.90 gives you the percentage.
Now the part most guides skip: a percent change on its own means very little. A 1.5 percent move is unremarkable in a mega-cap and large in a small-cap with a low beta. Percent change becomes useful only when you have seen what a normal day looks like for that particular stock over the past few months.
The same logic kills the urge to trade a single day’s move. Price moves in both directions for reasons that are largely independent of anything you learned from the quote.
Compare the open, previous close, day range, and 52-week range
The open is the first trade of the day. When the open sits far above the previous close, traders call it a gap up, and it almost always reflects news that arrived while the market was closed: earnings, guidance, an acquisition, a regulatory decision.
The day’s range is simply the lowest and highest trade so far this session. A wide range on a quiet-looking price means buyers and sellers disagreed sharply, which is useful information about how the stock behaves even when the net change looks calm.
The 52-week range extends that over a full cycle, and it is the fastest way to see how ordinary today’s price is. A stock sitting near the top of its yearly range after a 40 percent run is a different situation from one sitting near the bottom after a 40 percent fall, even though both can show the same percent change on the day.
One trap here. Historical quotes can be shown unadjusted, so a price from before a stock split looks artificially high next to today’s. Split-adjusted figures restate the old price to keep the chart continuous. When a company splits two-for-one, the previous close on an unadjusted page will look roughly double, and the percent change will look absurd unless you know why.
Check bid, ask, and volume
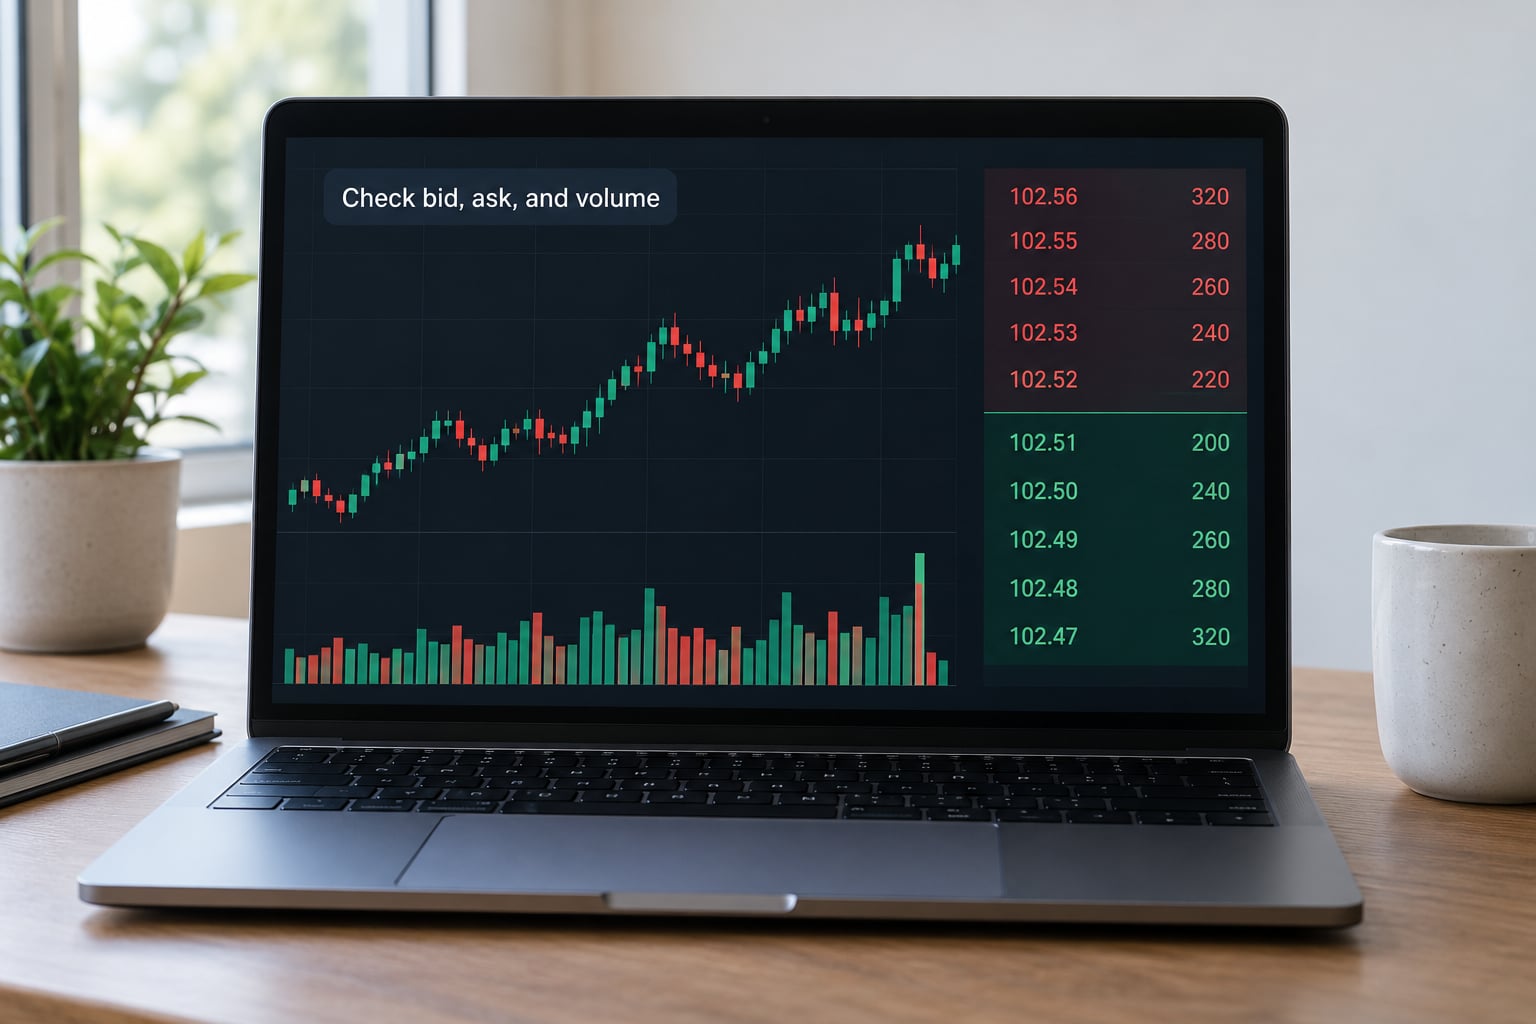
This is the part that decides what you actually pay. You buy at the ask and you sell at the bid, and the gap between them is the spread. On a heavily traded mega-cap the spread is often a cent or two. On a thinly traded small-cap it can be twenty cents or more, and on some over-the-counter names it can be several percent of the price.
On many screens the bid and ask are shown as price times size, such as 184.60 by 400 shares. That second number is how many shares are waiting at that price. A large number sitting on the bid means a seller of that size could fill immediately. A thousand shares resting on the ask when you want to buy 2,000 means you will pay more than the displayed ask.
Quantities are shown in lots. A round lot is 100 shares, the standard unit, and an odd lot is anything under 100. Exchanges report odd-lot trades separately because they behave differently, particularly in fast markets.
Volume tells you how many shares changed hands, which is the raw material of liquidity. Average volume, usually a three-month mean, is the comparison line: at 11am a stock might show 400,000 shares against an average of 1.2 million, which tells you the session is normal, not slow.
Bid volume and ask volume are a different cut of the same data. Bid volume is size offered to buy, ask volume is size offered to sell. Communities like the ones on r/options and Stock Twits read a wall of ask volume as resistance and a wall of bid volume as support, and while that reading is closer to a mood indicator than a method, it does describe where the visible liquidity sits.
Interpret dividend, yield, and other quote statistics
Not every company pays a dividend, so these fields show blank or zero across a large share of the market, including most technology names. Where a dividend exists, yield is the annual payout divided by the share price, which means yield falls when price rises even though the payout has not changed at all.
The ex-dividend date is the detail beginners get wrong most often. A stock trades without its dividend entitlement from that date, so buying the day before does not secure the payment; the price usually adjusts down by roughly the dividend amount on the ex-date.
Market cap, shares outstanding and float belong to the same family. Market cap is price times shares outstanding, so it moves every time the stock does, and it describes size rather than value. A company can double in market cap without a single share being issued.
P/E and EPS describe the relationship between price and trailing earnings. P/E is price divided by trailing twelve months of earnings per share, and it is only comparable between companies whose earnings are broadly similar and stable. A high multiple on a company with falling earnings usually signals a recovery the market expects, not a bargain.
Beta measures how far a stock has moved with the market over roughly three years. It is a sensitivity number, not a risk score, and a stock can have a beta below one and still lose half its value in a single quarter.
Everything from here on is a link away from the quote itself: earnings dates, analyst targets, the last ten years of revenue and margin. Reading the quote well means knowing when to stop reading the quote and start reading the company.
Common Mistakes When Reading a Stock Quote
Treating the last price as the price you will get. It is a completed trade, not an offer. Your fill depends on your order type, the spread and how much size is available when your order arrives.
Assuming a free quote is live. Many general finance sites publish data delayed by 15 minutes, and the delay is not always labelled. Check the timestamp before reacting to a move.
Reading one day’s change as a trend. A single session carries no information about direction. Look at the range and the 52-week position instead, then decide whether you even need a reaction today.
Ignoring splits and adjusted prices. A 4-for-1 split makes an unadjusted chart look like a 75 percent collapse. Check whether the historical prices are adjusted before drawing any conclusion from a long chart.
Using volume as a buy signal. Heavy volume means participation, not direction. Every trade has a buyer and a seller, and a big volume spike often means two large holders finished arguing, which can go either way afterwards.
Reading beta as risk of loss. Beta describes co-movement with the market. It says nothing about company-specific disasters, and plenty of low-beta stocks have fallen hard on single news events.
Confusing a quote with a chart or with analysis. The quote is a snapshot. The chart is history. Analysis is the work you do on both. Mixing the three leads to decisions that the data never supported.
Trading a thin stock with a market order. Experienced traders on retail forums repeat one piece of advice constantly: use a limit order, particularly on anything that is not a mega-cap. A market order on a wide-spread name pays the whole spread without being told.
Tips for Using Stock Quotes Wisely
Start with the session. The same stock shows three different prices depending on when you look, and knowing which one you are reading removes most of the confusion beginners report.
| Data type | Typical delay | Where you see it | Effect on your order |
|---|---|---|---|
| Real-time regular session | None | Brokerage platforms during exchange hours | Bid and ask reflect the live book |
| Delayed regular session | Usually 15 minutes | Many free public finance pages | The bid and ask may be stale or absent |
| Pre-market | Live but thin | Broker platforms, roughly 4am to 9:30am ET | Wide spreads, prices can gap at the open |
| After-hours | Live but thin | Broker platforms, roughly 4pm to 8pm ET | Spreads widen, order books are shallow |
Then set a spread threshold you actually follow. For a beginner trading a liquid large-cap, a spread of a penny or two is unremarkable. Once you see a spread wider than roughly half a percent of the price, use a limit order and expect the fill to take longer, because you are asking the market for a specific price instead of taking whatever is offered.
Cross-check one quote against a second free source before a large order. If the last price, previous close and volume broadly match, the data is trustworthy. If they do not, one feed is stale or you are looking at two different securities with similar tickers.
Use the quote for execution decisions and the filings for investment decisions. The screen tells you what it costs to act right now. The 10-K, the 10-Q and the earnings release tell you what you are buying, and mixing those two jobs up is how a well-read chart turns into a bad investment.
Finally, watch the calendar. Earnings dates, ex-dividend dates and index rebalances cause scheduled gaps, and no amount of quote reading removes that risk. If you hold through an earnings report, you have accepted a two-sided move before the report, not after it.
This is general education about market data, not investment advice. Rules, order types and quote feeds vary by country, exchange and broker, so check what your own broker publishes.
Frequently Asked Questions
How do I read a stock quote as a beginner?
Read it in a fixed order every time: ticker and exchange first, then last price, then change and percent change against the previous close, then bid, ask and spread, then the day’s and 52-week ranges, then volume compared with average volume, and only then market cap and valuation fields. That order takes about two minutes and keeps you from reacting to a number before you know what it means.
How do I know the actual price of a stock?
There is no single actual price. The last price is the most recent completed trade, the bid is the highest anyone is offering, and the ask is the lowest anyone will accept. What you actually pay depends on your order type, the spread, how much size is available, and whether the market is open. A limit order at or inside the ask tells you the most control over that price.
What is the bid-ask spread and why does it matter?
The spread is the ask price minus the bid price, and it is a real cost you pay on entry and again on exit. You buy at the ask and sell at the bid, so a one-cent spread on a liquid large-cap is negligible, while a spread of half a percent on a thinly traded small-cap can consume a meaningful share of any small gain. Wide spreads are a warning to use a limit order.
Are free stock quotes real time or delayed?
Most free public quote feeds are delayed, commonly by 15 minutes, and some are not labelled as such. Brokerage platforms usually show real-time data during exchange hours but require an exchange data agreement or a paid subscription tier. Always check the timestamp on the quote itself before you act on a move, and remember that delayed feeds often show no live bid or ask at all.
Is it better to buy a stock with high volume or low volume?
High volume is better for execution, because it usually means a tight spread and enough size available to fill your order without moving the price. Low volume is the riskier condition, not the bargain one. But the volume level itself is not a buy signal: volume measures participation, and every trade has both a buyer and a seller. Compare today’s volume with the stock’s own average volume before drawing conclusions.
What does the 52-week range mean on a stock quote?
The 52-week range is the lowest and highest price the stock traded at over the past year, rolling forward day by day rather than resetting on January 1. It gives you today’s price in the context of a full cycle. Sitting near the top of that range means the price has already travelled a long way, which changes how you read a large percent change on the day.
Conclusion
To read a stock quote, start with the company and ticker, then read price and change together as a pair rather than a headline, then check the bid, ask and spread before anything else on the screen, and place volume and the 52-week range next to their own averages rather than reading them alone.
Check the timestamp so you know which session you are looking at, and remember the fill comes from the order book, not from the last price. That two-minute routine is the whole skill, and it is what separates a considered trade from an expensive mistake.